Tessera Viz
PX-02
Surface 02
81 chart types. Learn one, and you know them all.
Every chart reads the same data shape, takes the same options and obeys the same theme tokens. Swap bar for waterfall and the chart changes; nothing else does.
01
What it is
06
Surface 02 · Charts
Switch chart types without rewriting anything.
There is no per-chart configuration dialect to relearn on your fourteenth chart, and no second theming system to keep in step with the first. Swap bar for waterfall and the chart changes; nothing else does.
81
Chart types
10
Families
690
Style tests
2
Token sets
02
See it
06
Try it yourself.
The 26 free kinds draw live; the 55 Pro kinds are pictures drawn by Tessera Viz Pro, marked Pro. Filter by the question you want to answer; click any chart to see it large, next to the complete JSON that draws it.
Filter
By the question you are asking
Click a chart
See it large, with its JSON
Hover a mark
Read the value
One JSON shape and one theme draw every chart here — the colours are this site's, passed in as a theme. Swap bar for waterfall and the chart changes; nothing else does.
03
Find yours
06
Every chart you'll need, all working the same way.
The full list — find yours.
10 FAMILIES
Comparison
bar
horizontal bar
divergent bar
stacked area
butterfly
dumbbell
dot plot
lollipop
bullet
marimekko
mosaic
waterfall
pyramid
chevron
Trend over time
line
area
spline
step
sparkline
stream graph
ridge
bump
slope
connected scatter
calendar
punchcard
stripes
cycle
spiral
barcode
Distribution
histogram
box plot
violin
beeswarm
density
Q–Q plot
percentile
error bar
range
contour
Part to whole
pie
donut
semi-donut
rose
polar area
waffle
pictogram
treemap
sunburst
icicle
bubble pack
funnel
Correlation
scatter
bubble
hexbin
heat map
matrix
quadrant
parallel coordinates
radar
ternary
Flow and relationship
Sankey
alluvial
chord
arc
hive
dendrogram
bracket
fan
ribbon
Geospatial
choropleth
vector field
Financial
candlestick
OHLC
Kagi
Renko
Indicator
gauge
progress ring
radial bar
KPI card
KPI grid
Composition
combo
small multiples
timeline
Published as names rather than categories, because a reader with an unusual requirement is scanning for their one chart and a heading will not satisfy them. Several are variants that share a renderer — lollipop is a bar, spline and step are lines, histogram is a bar, bubble is a scatter — which is why the names here outnumber the type count.
04
What it draws
06
Real charts, real data.
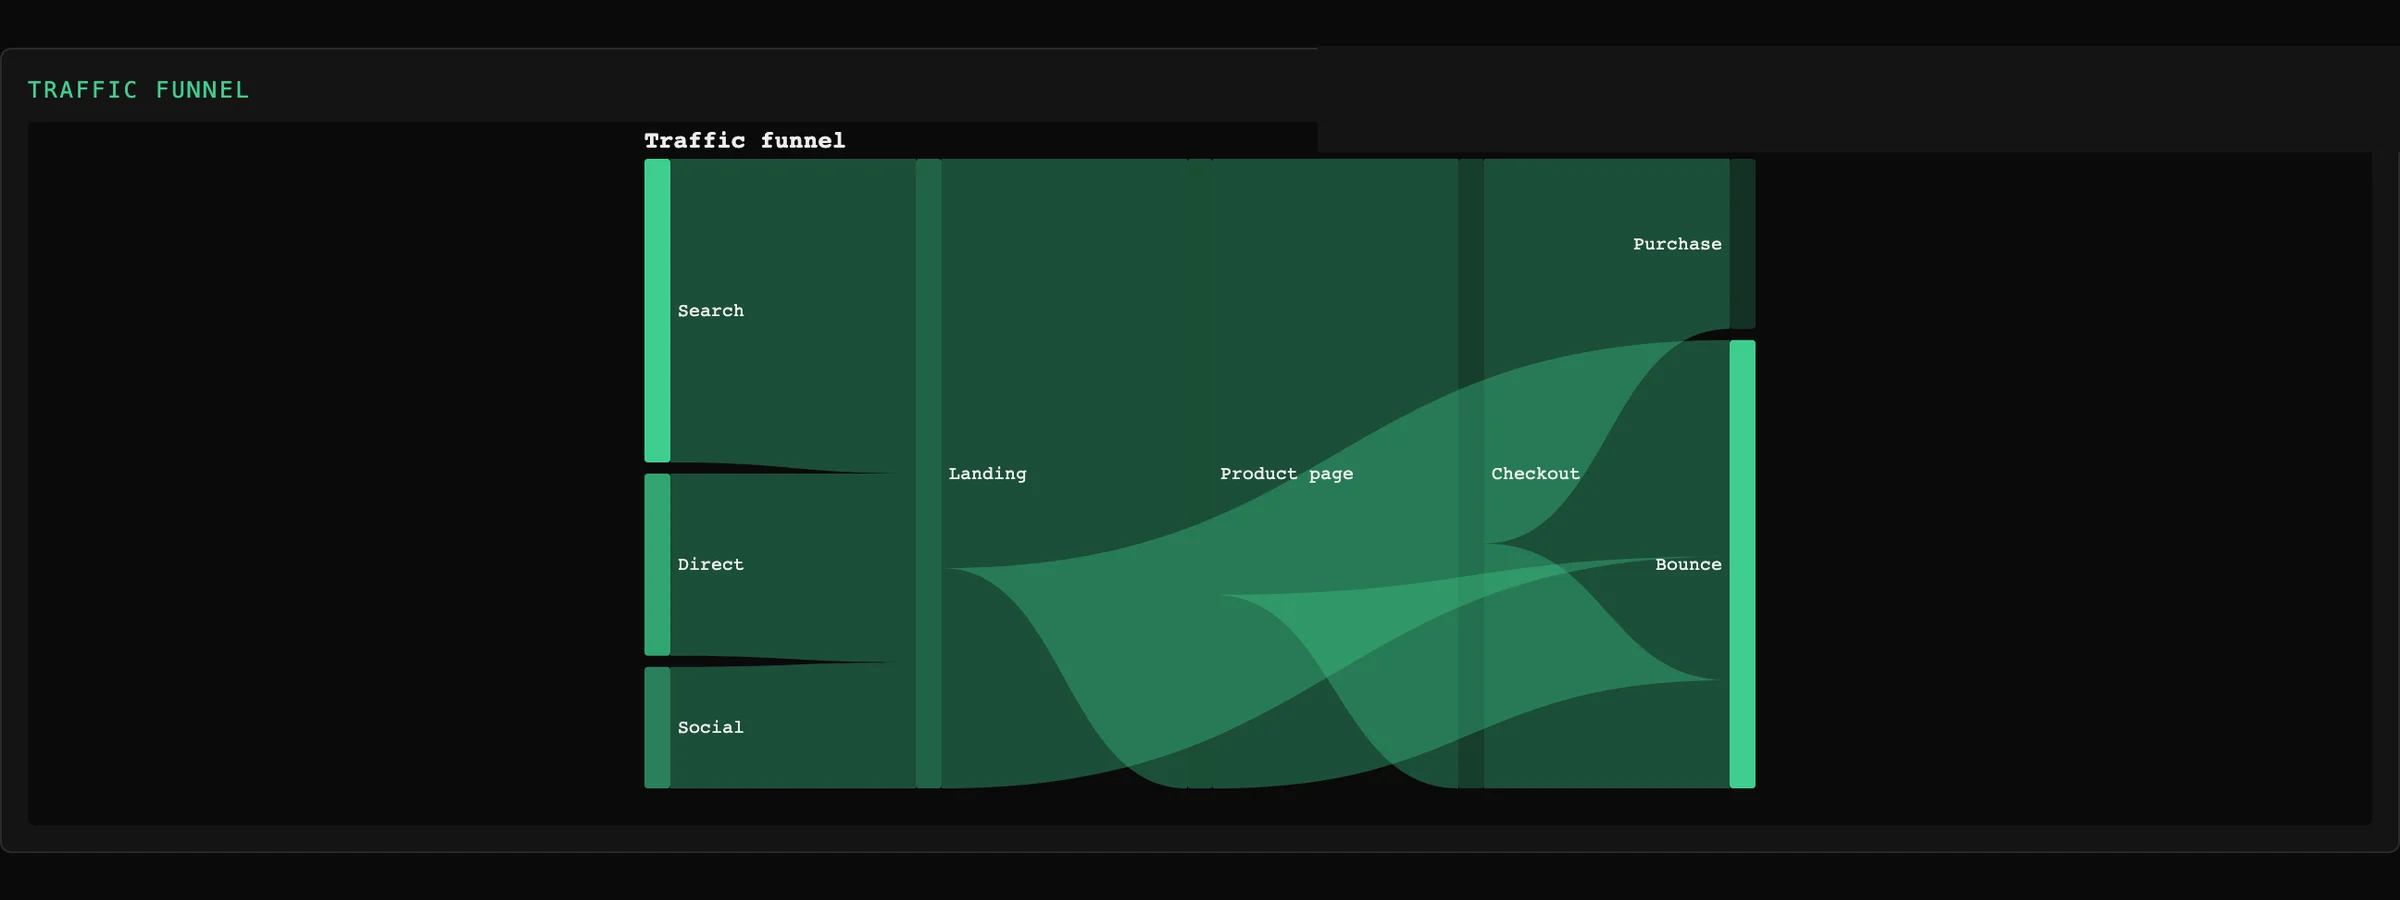
Sankey
Flow and relationship
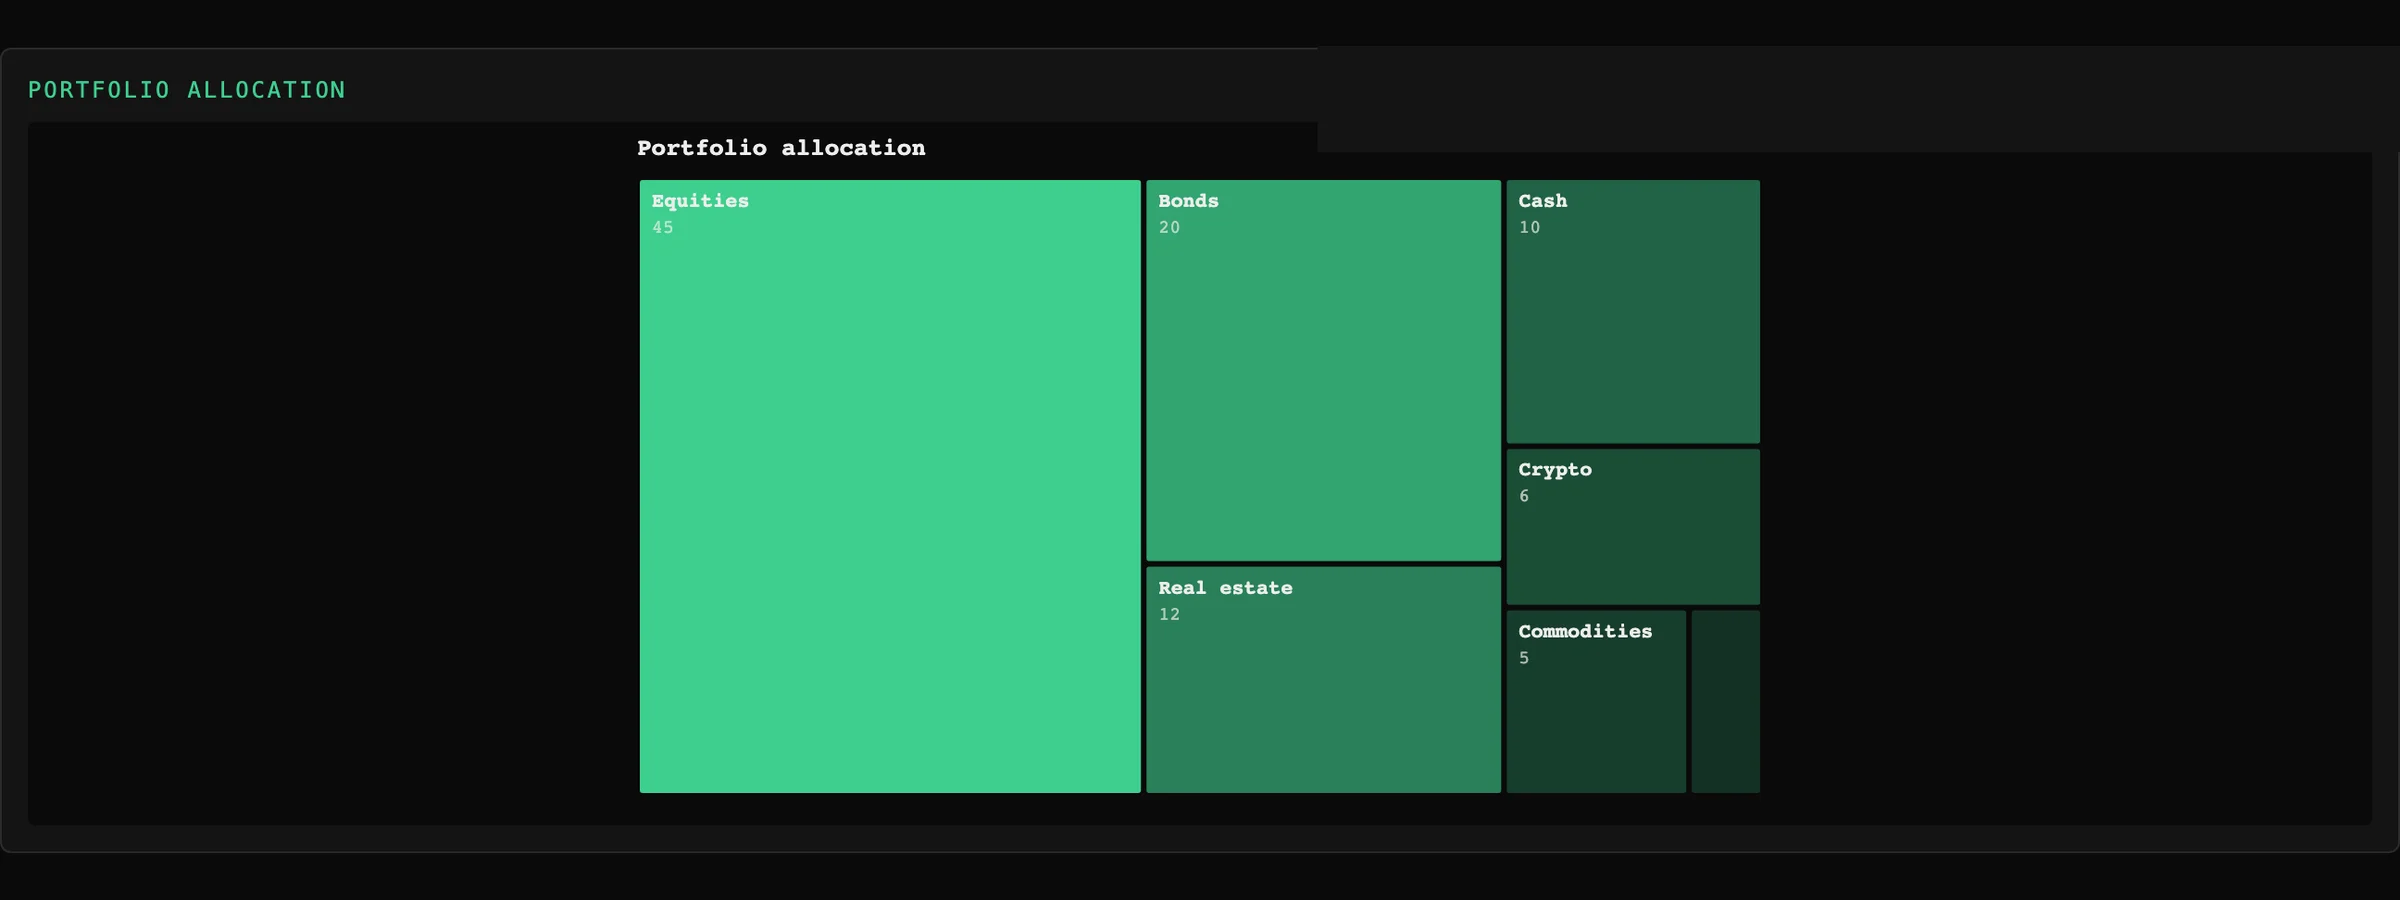
Treemap
Part to whole
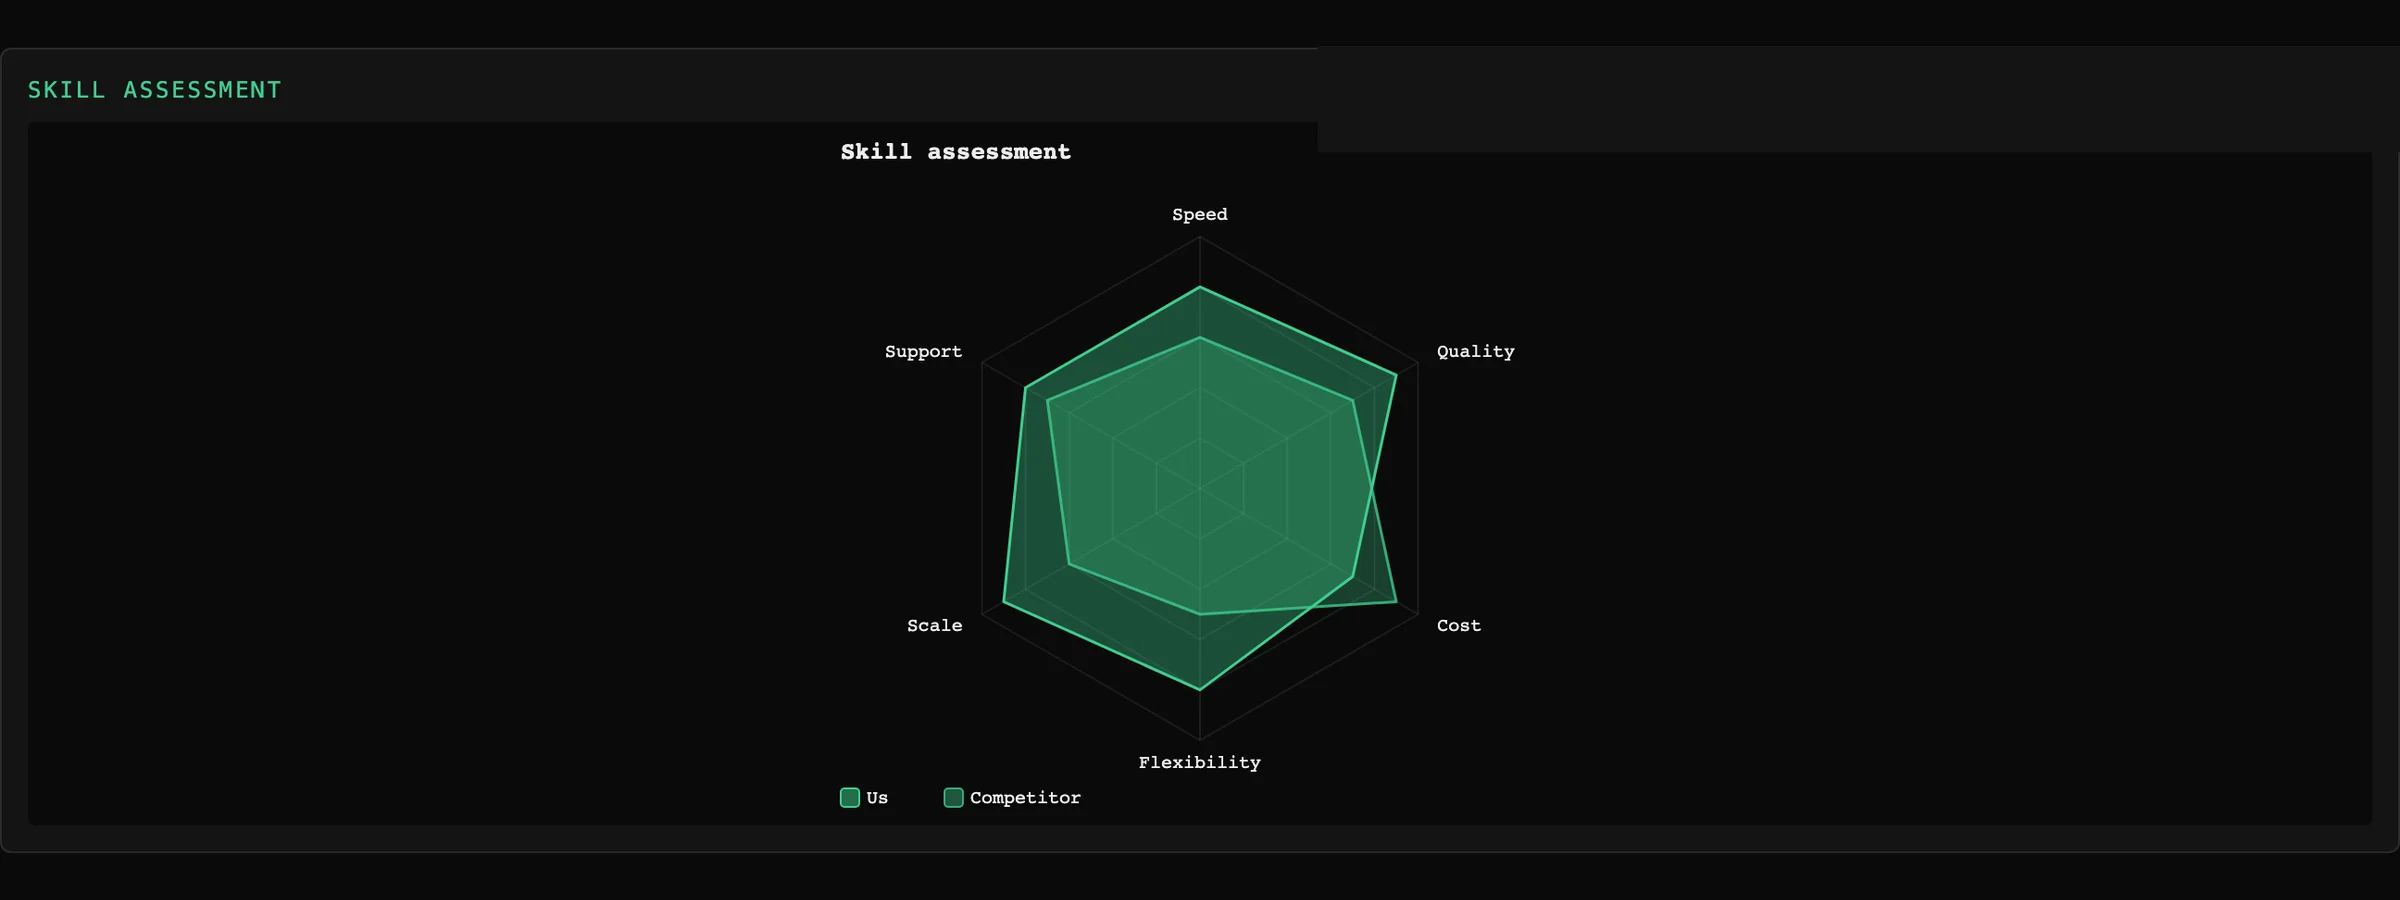
Radar
Correlation
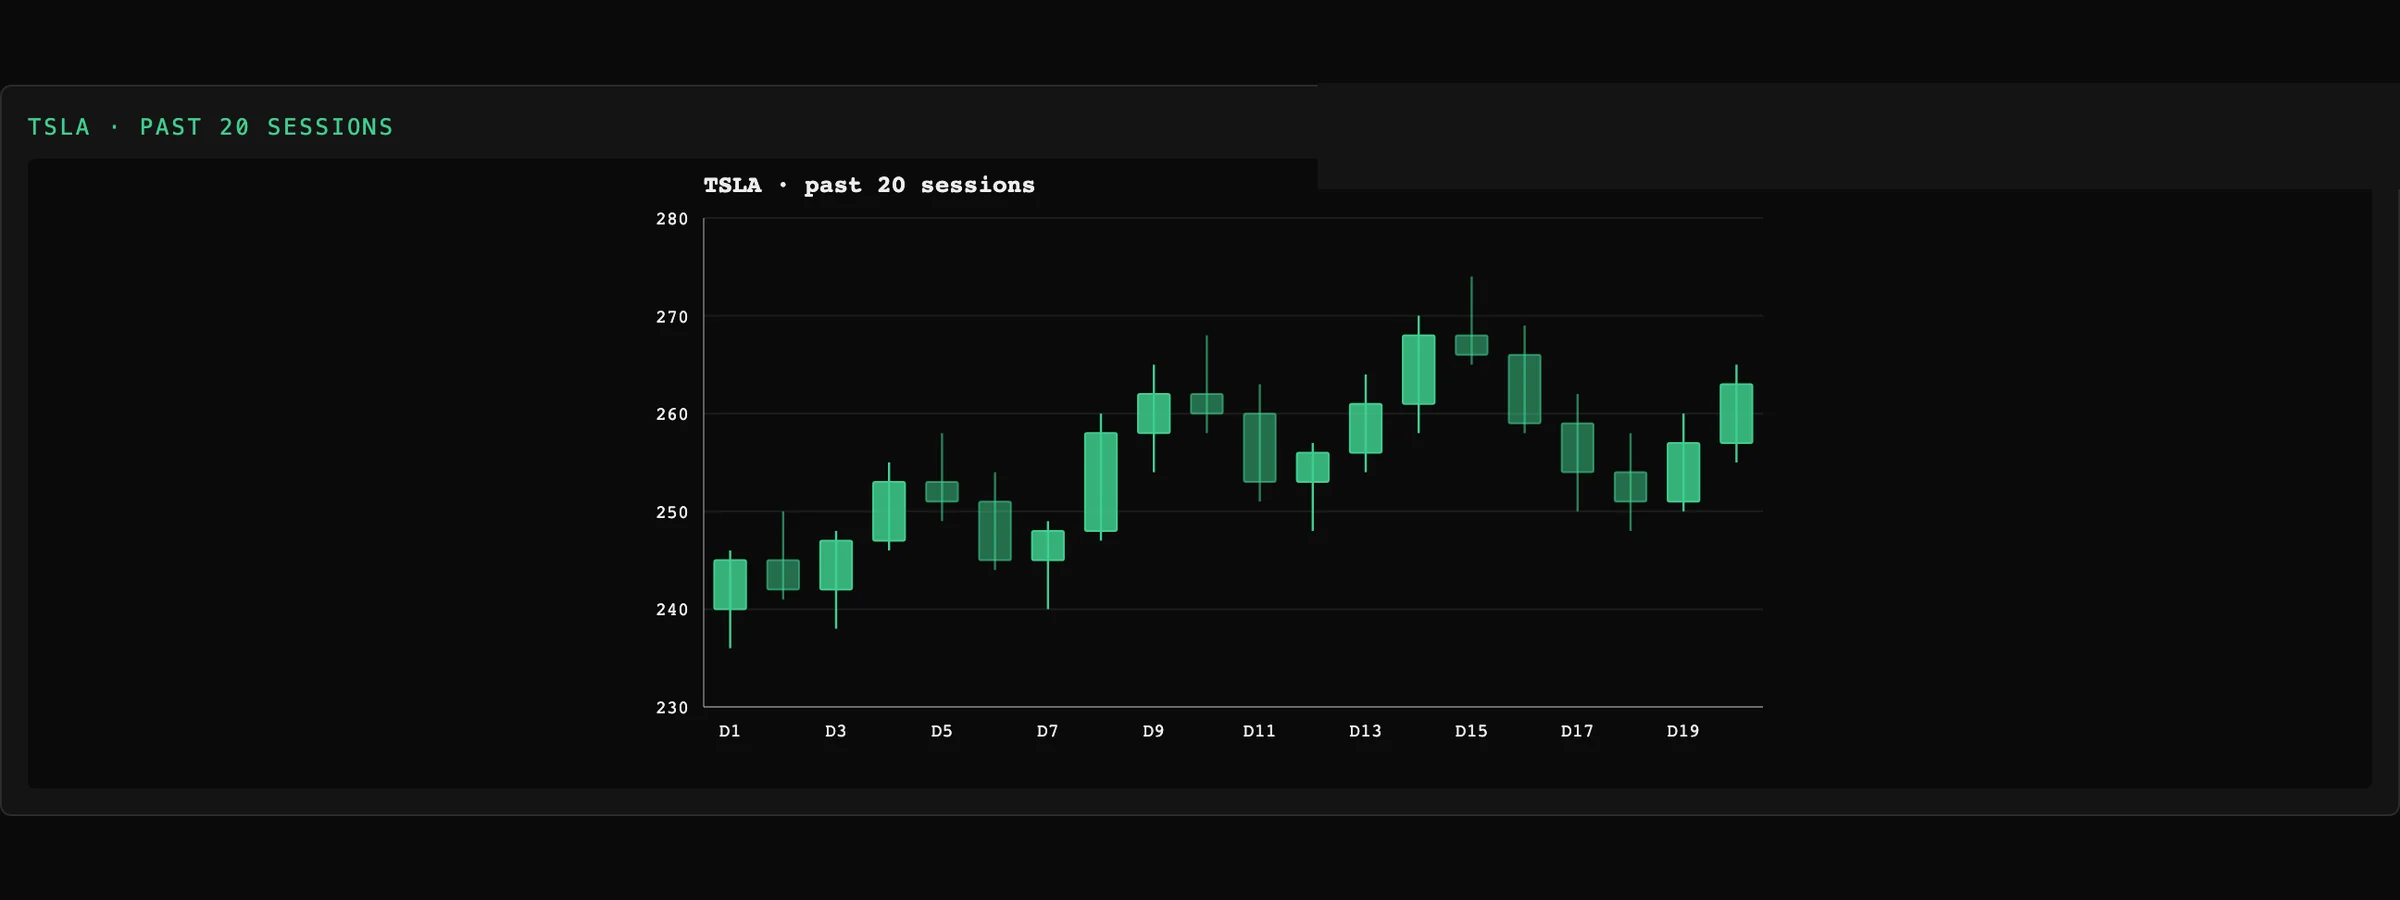
Candlestick
Financial
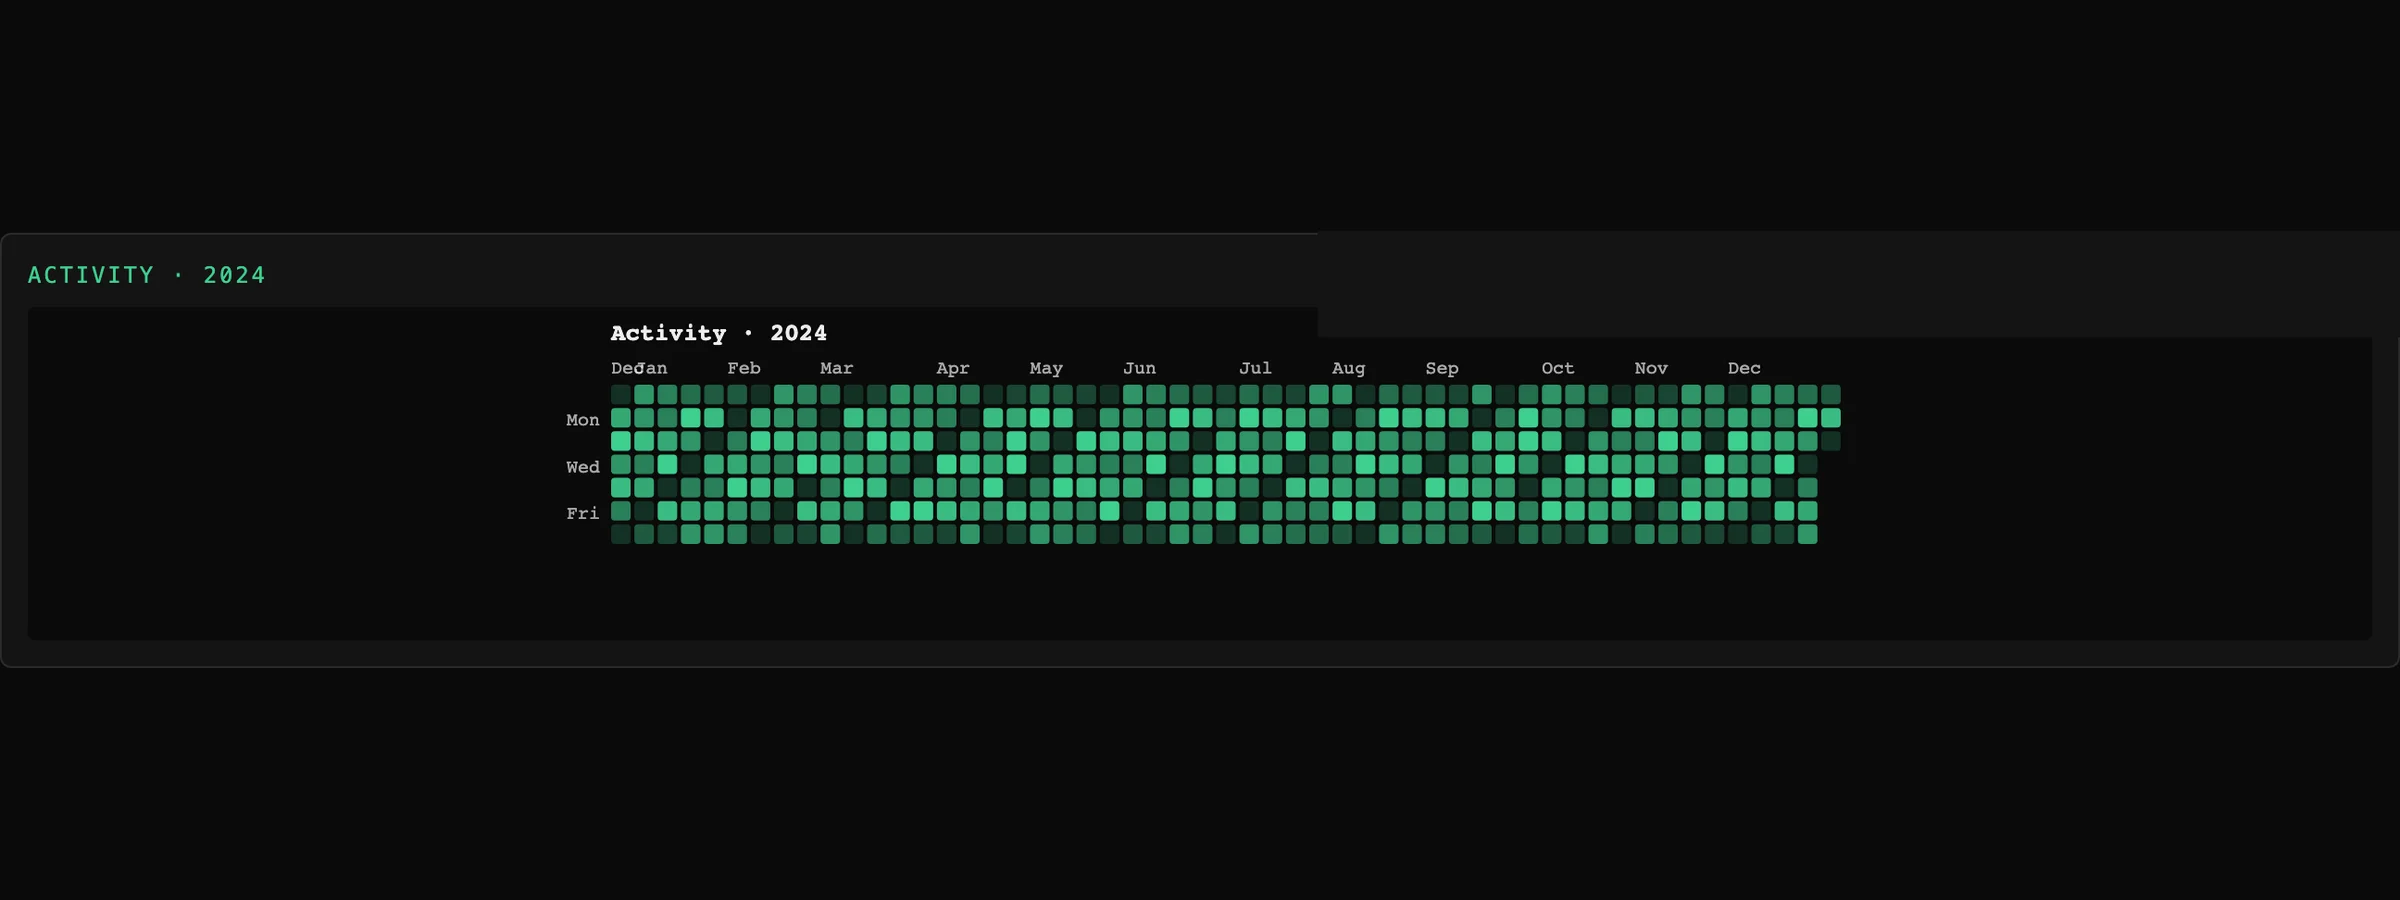
Calendar
Trend over time
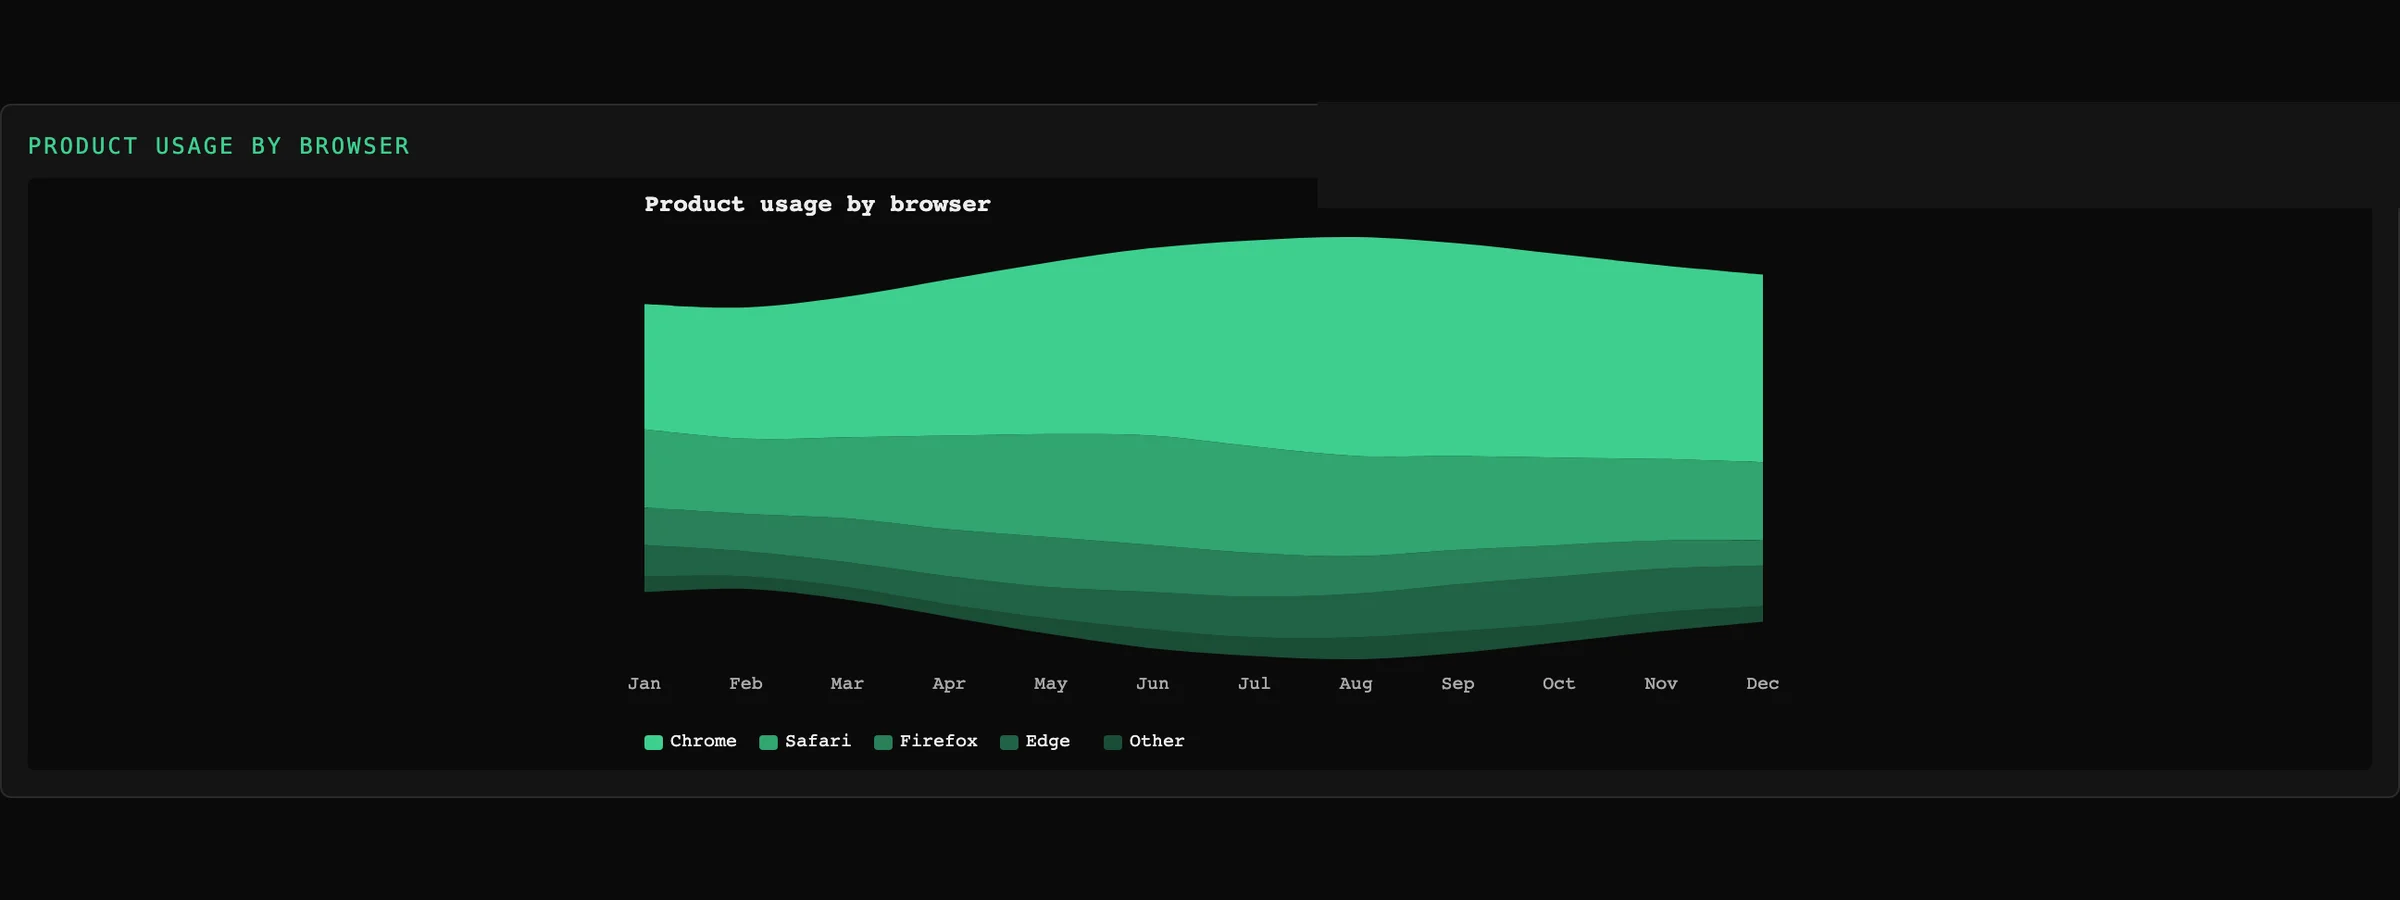
Stream graph
Trend over time
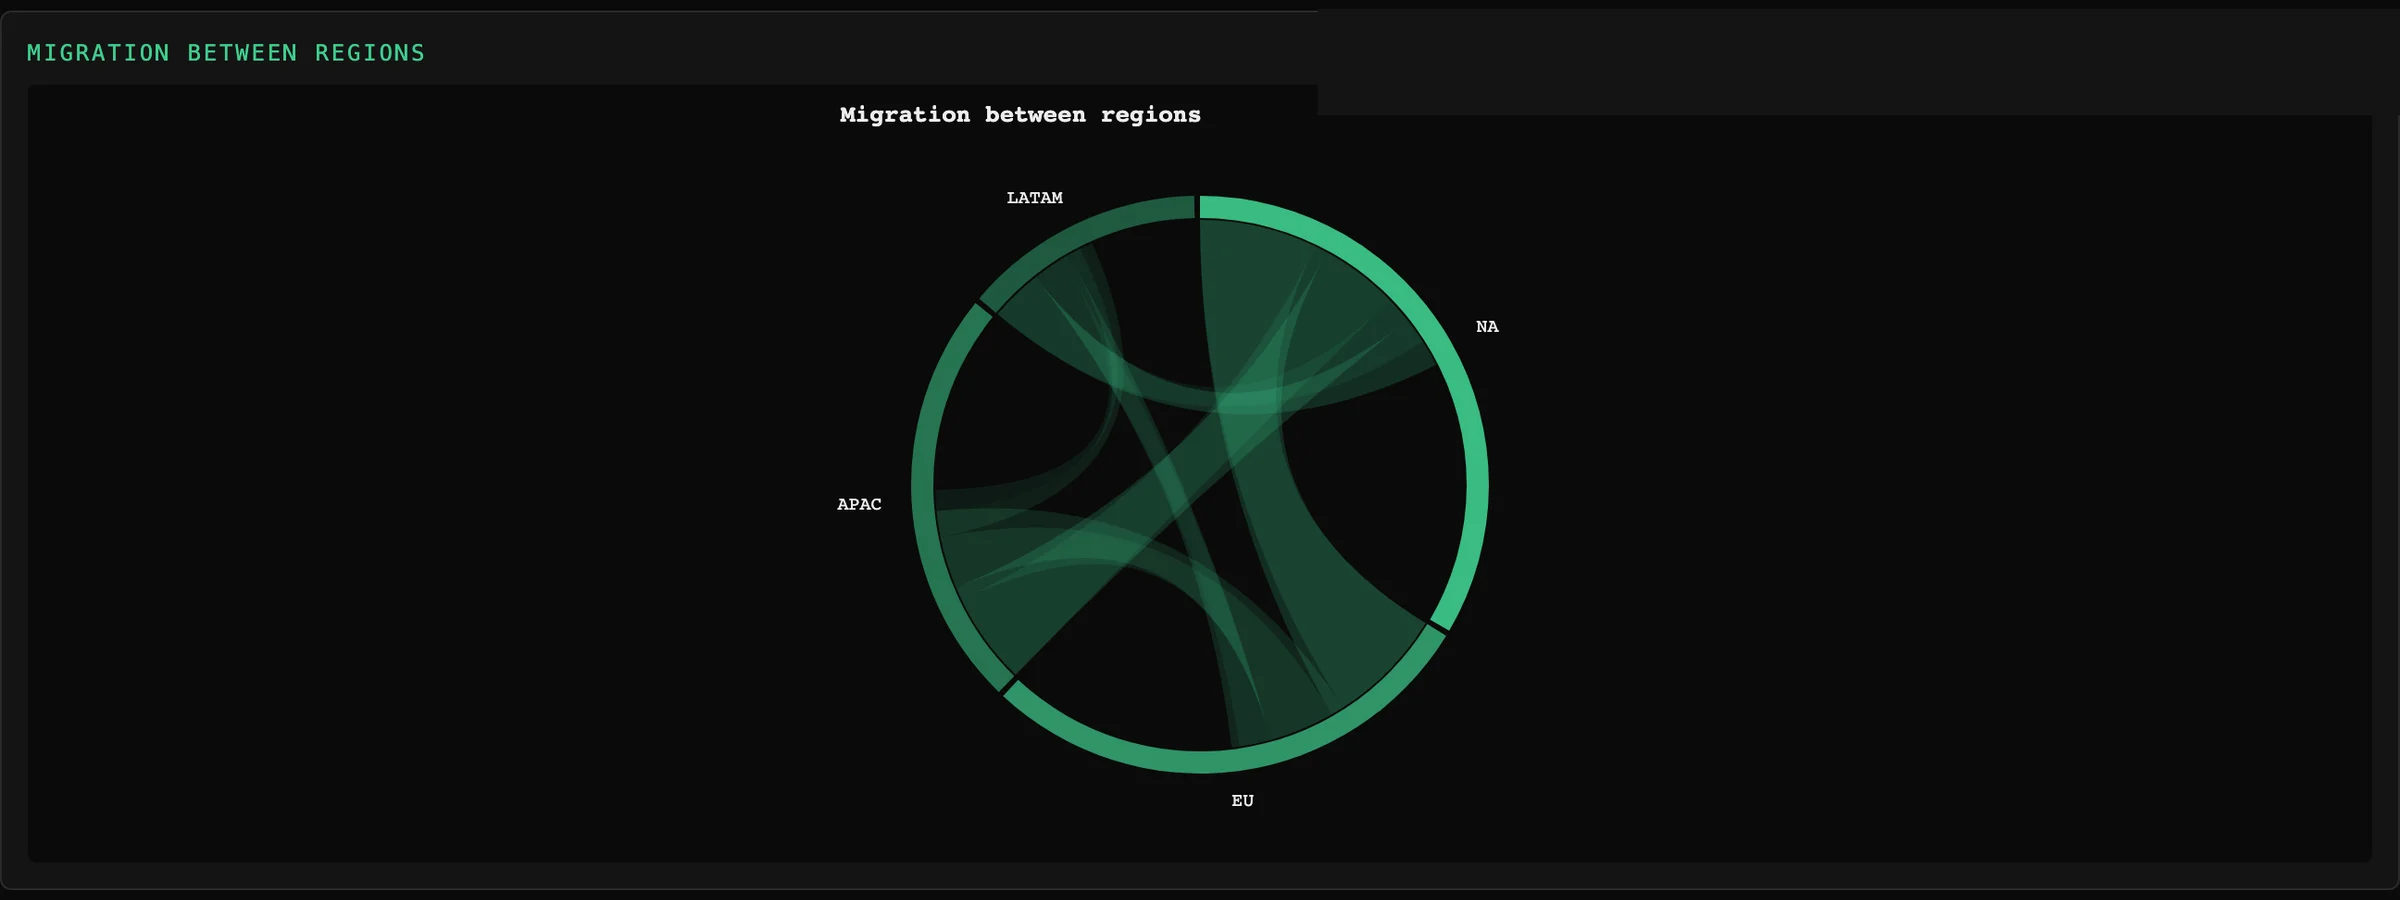
Chord
Flow and relationship
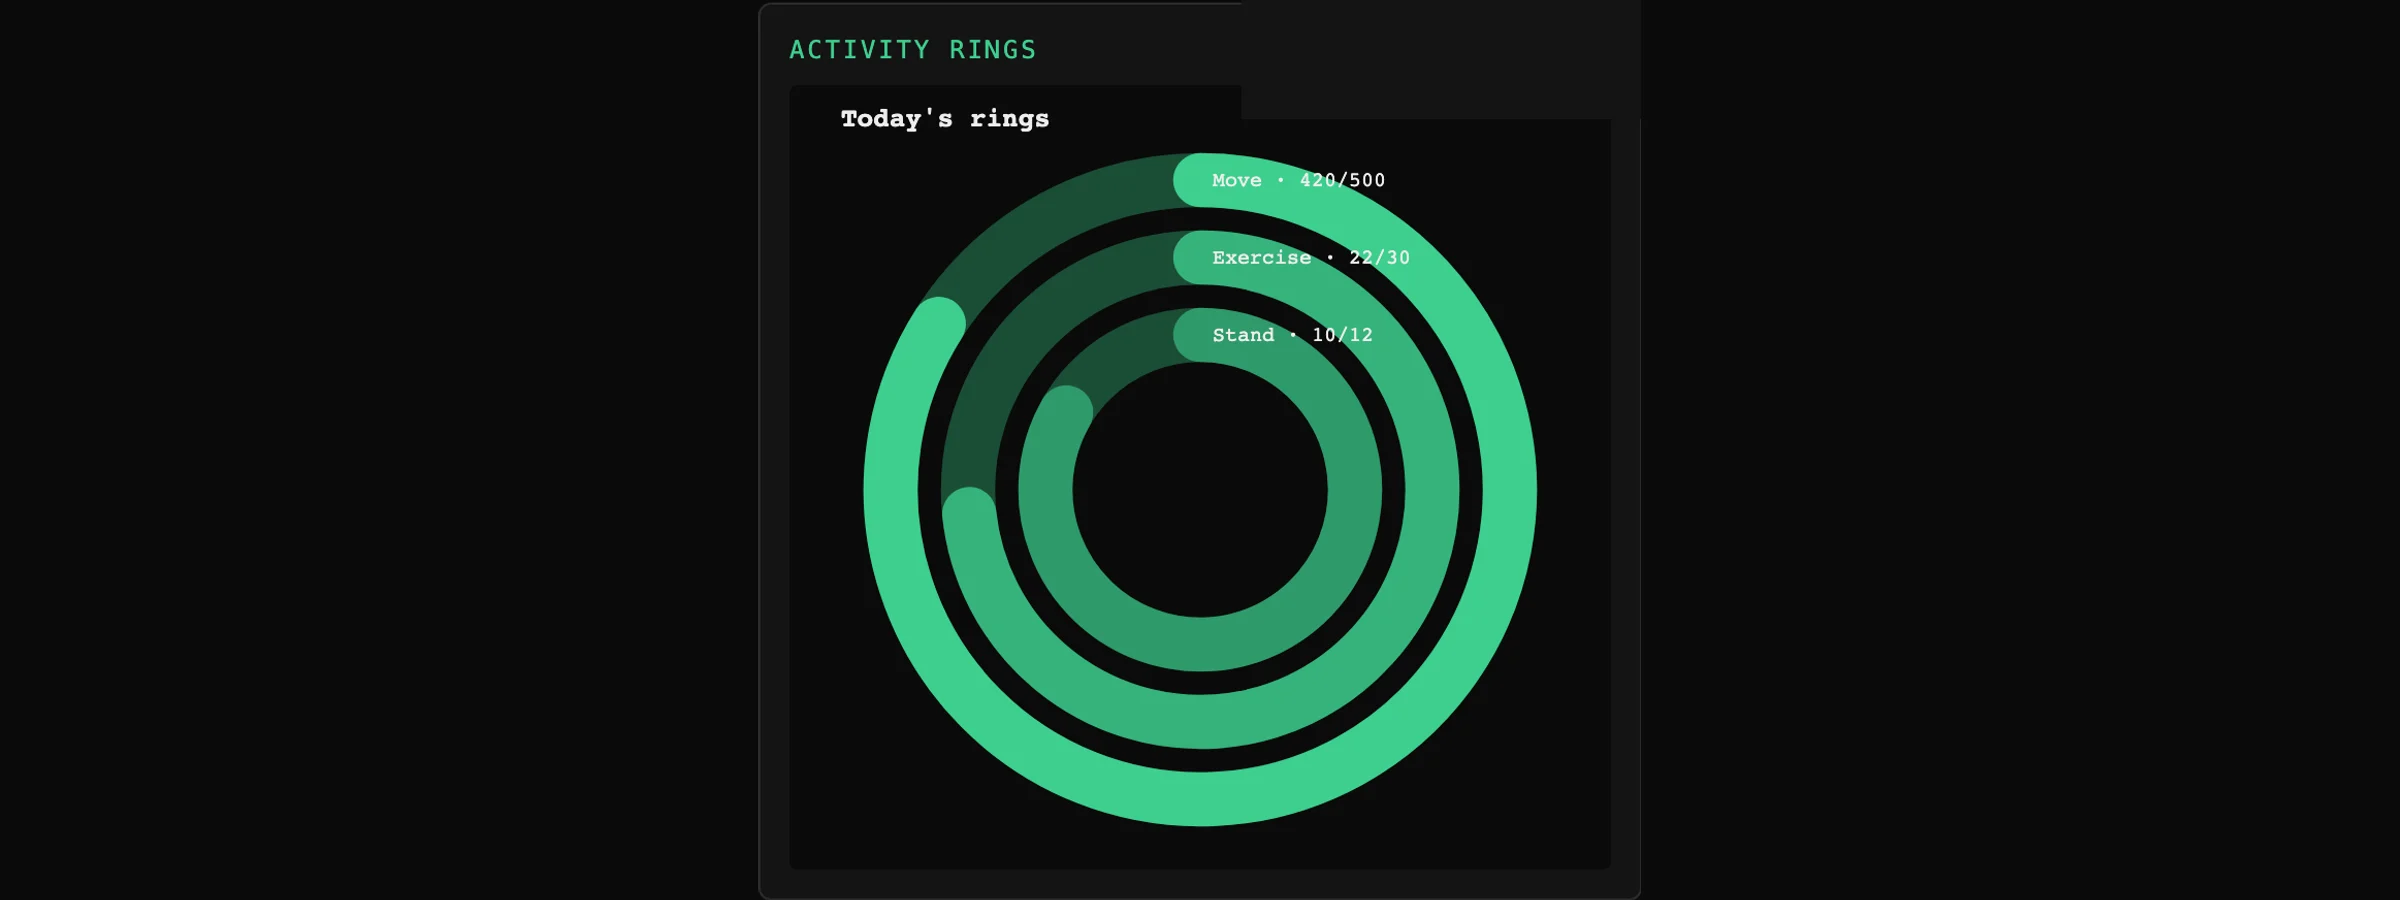
Radial bar
Indicator
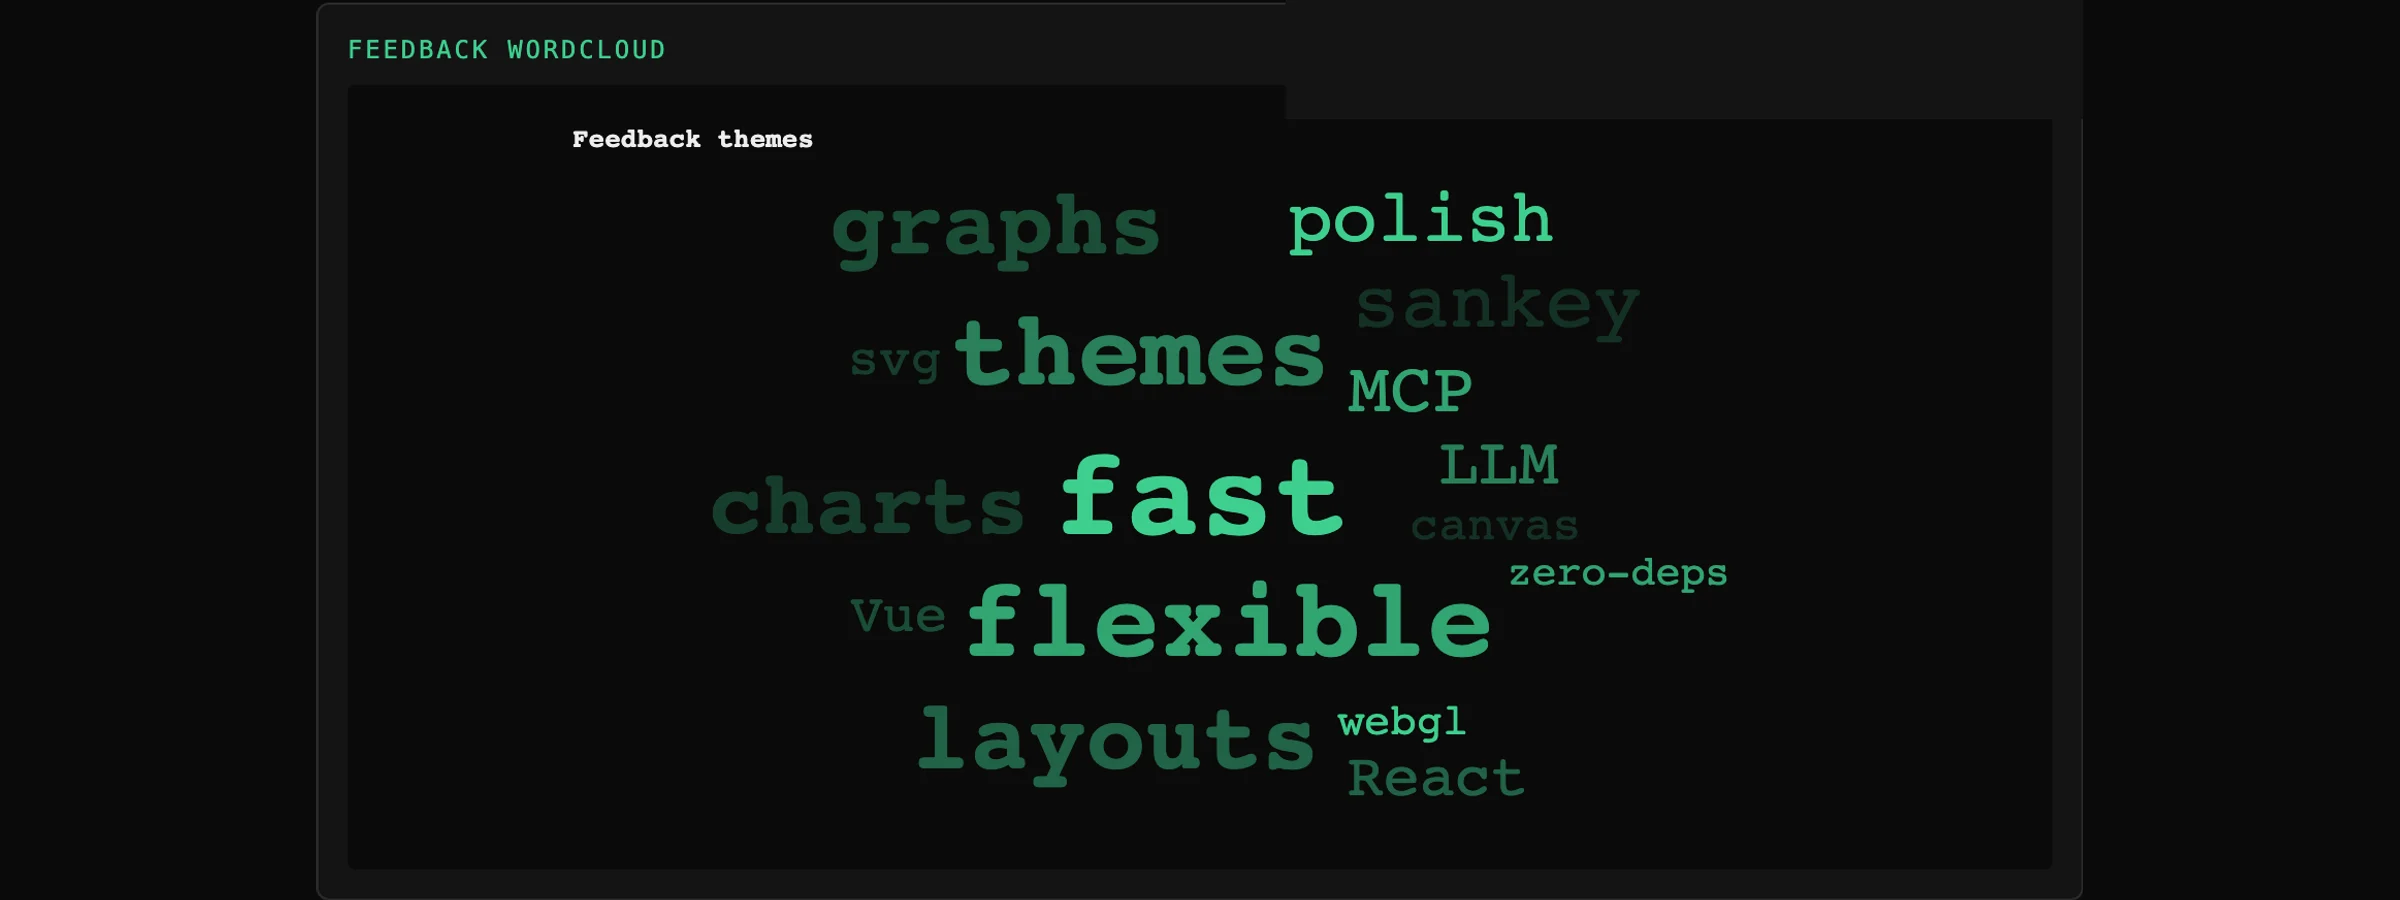
Word cloud
Indicator
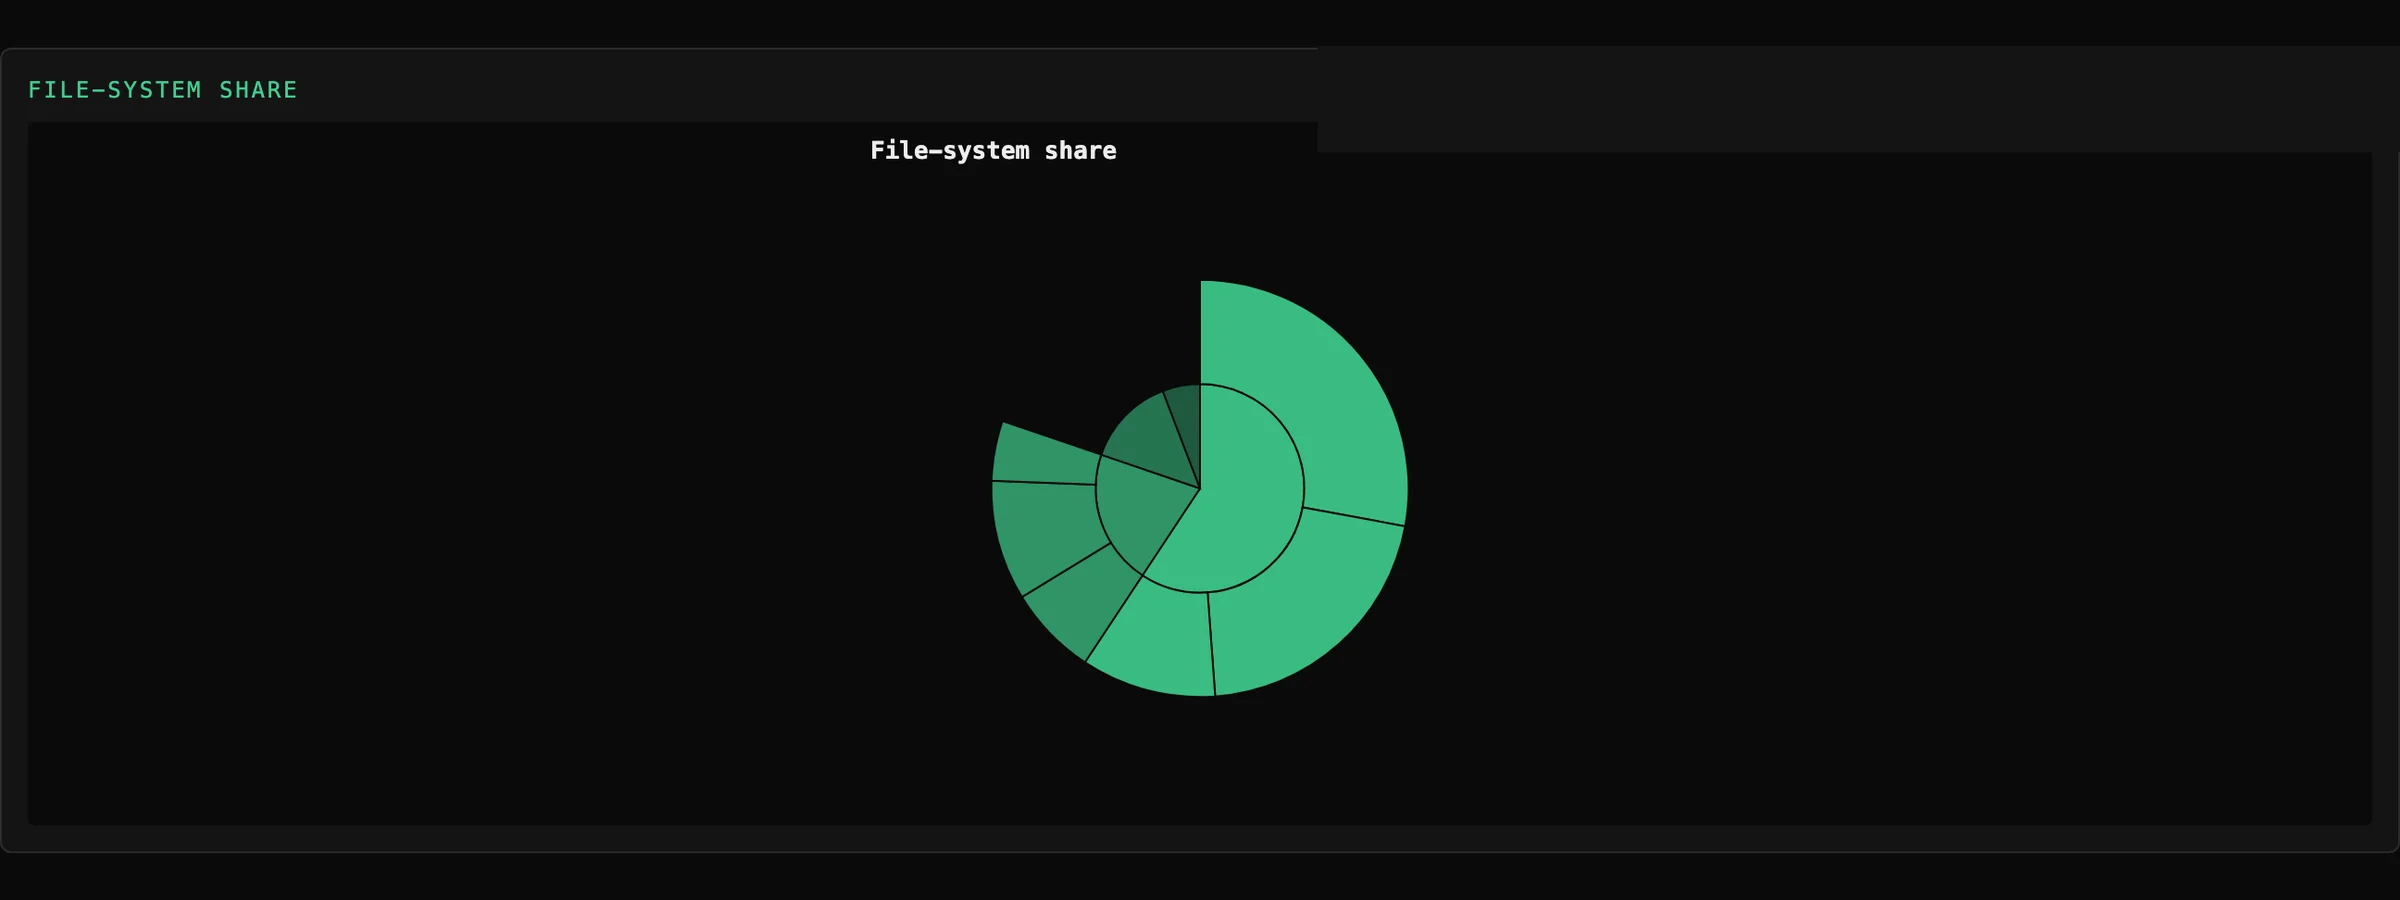
Sunburst
Part to whole
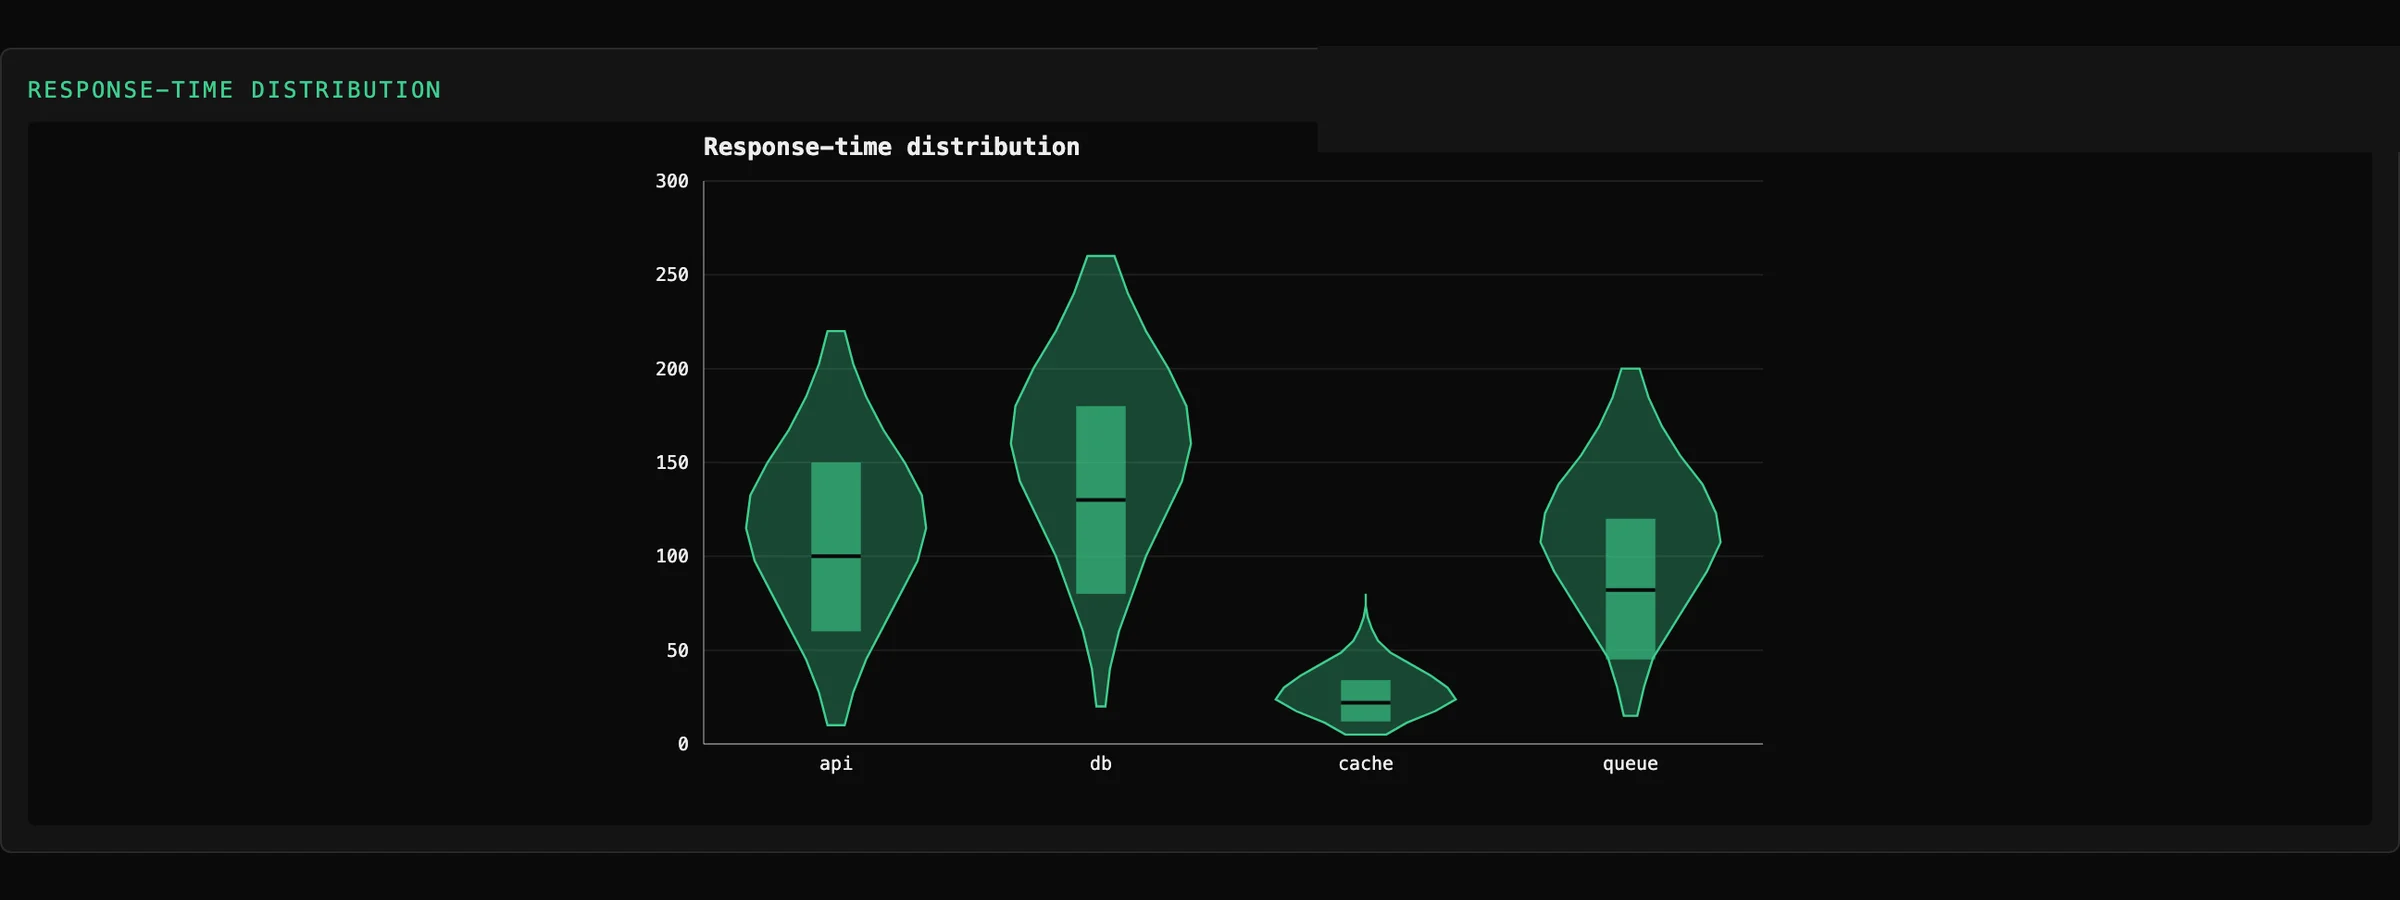
Violin
Distribution
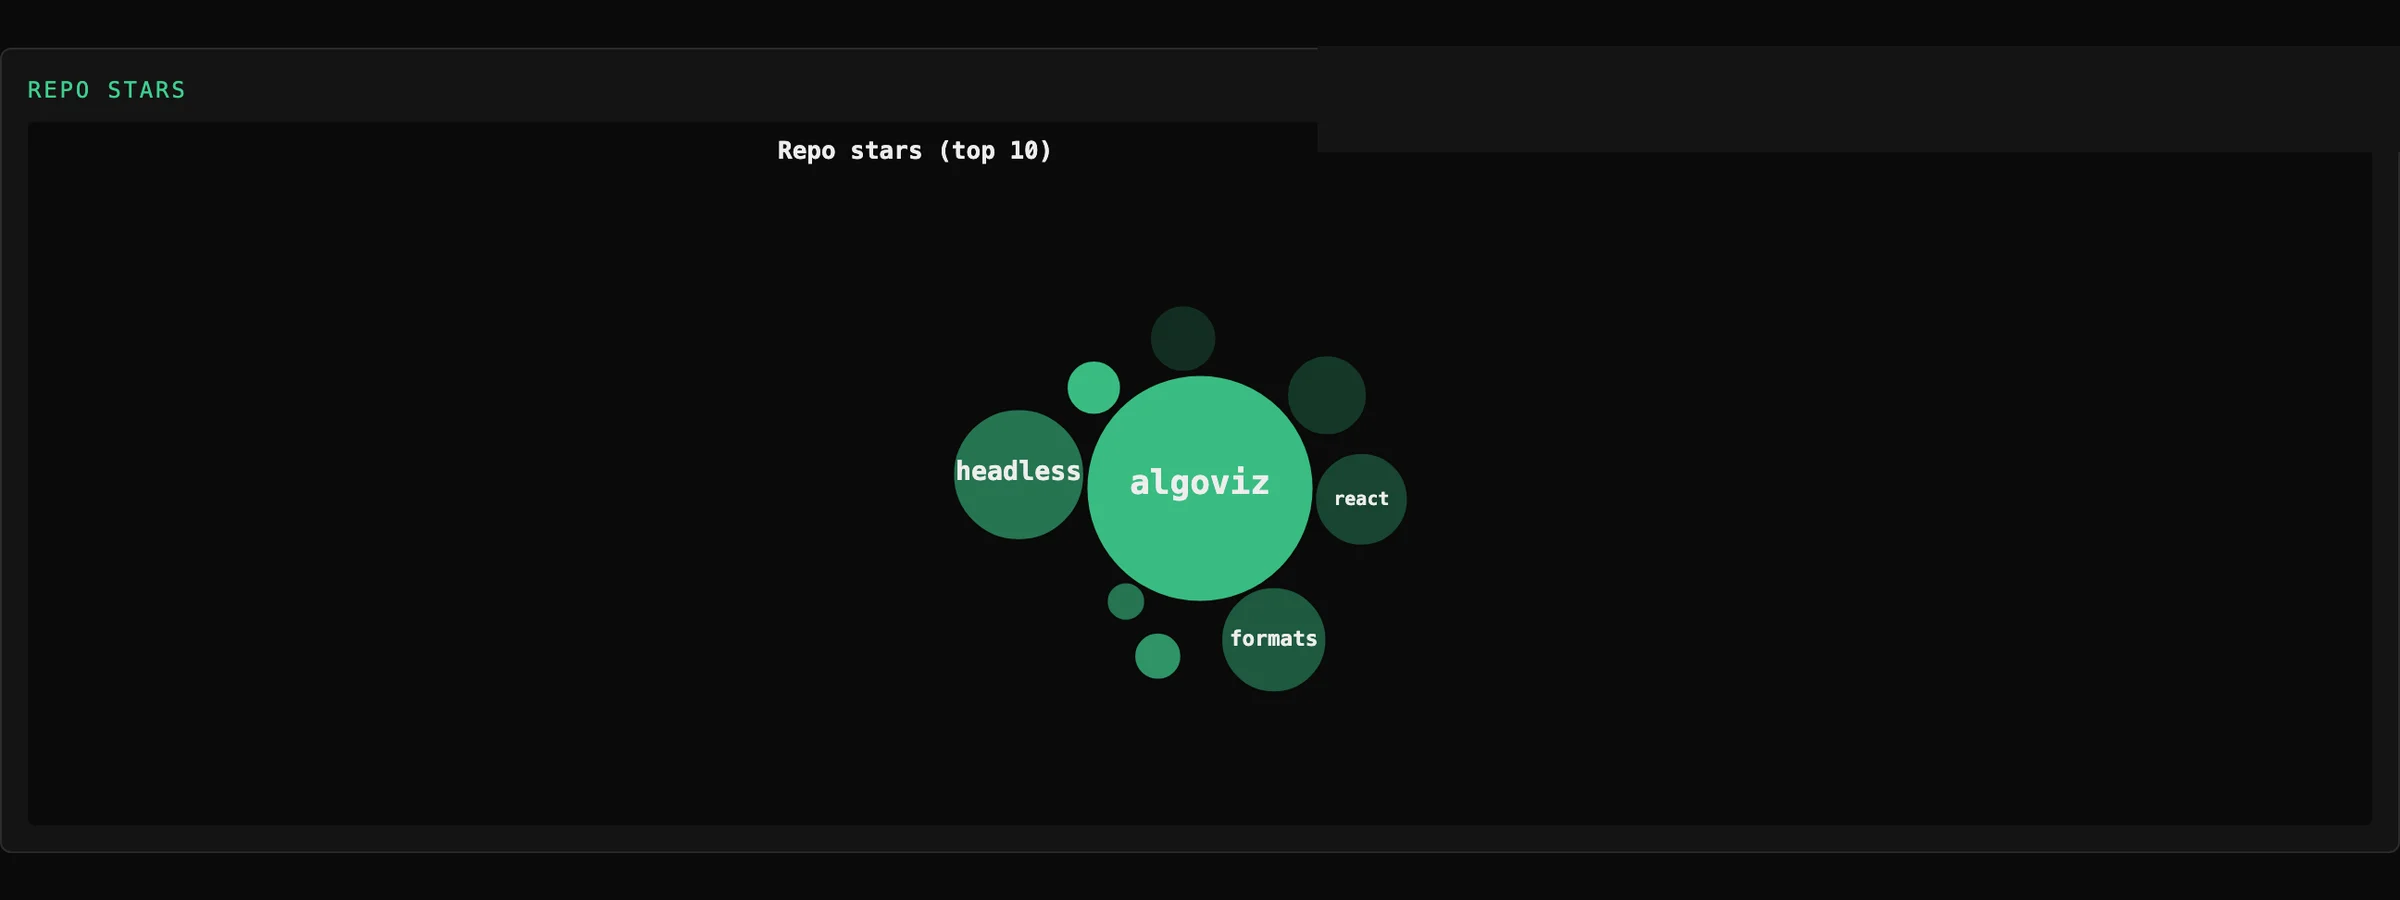
Bubble pack
Part to whole
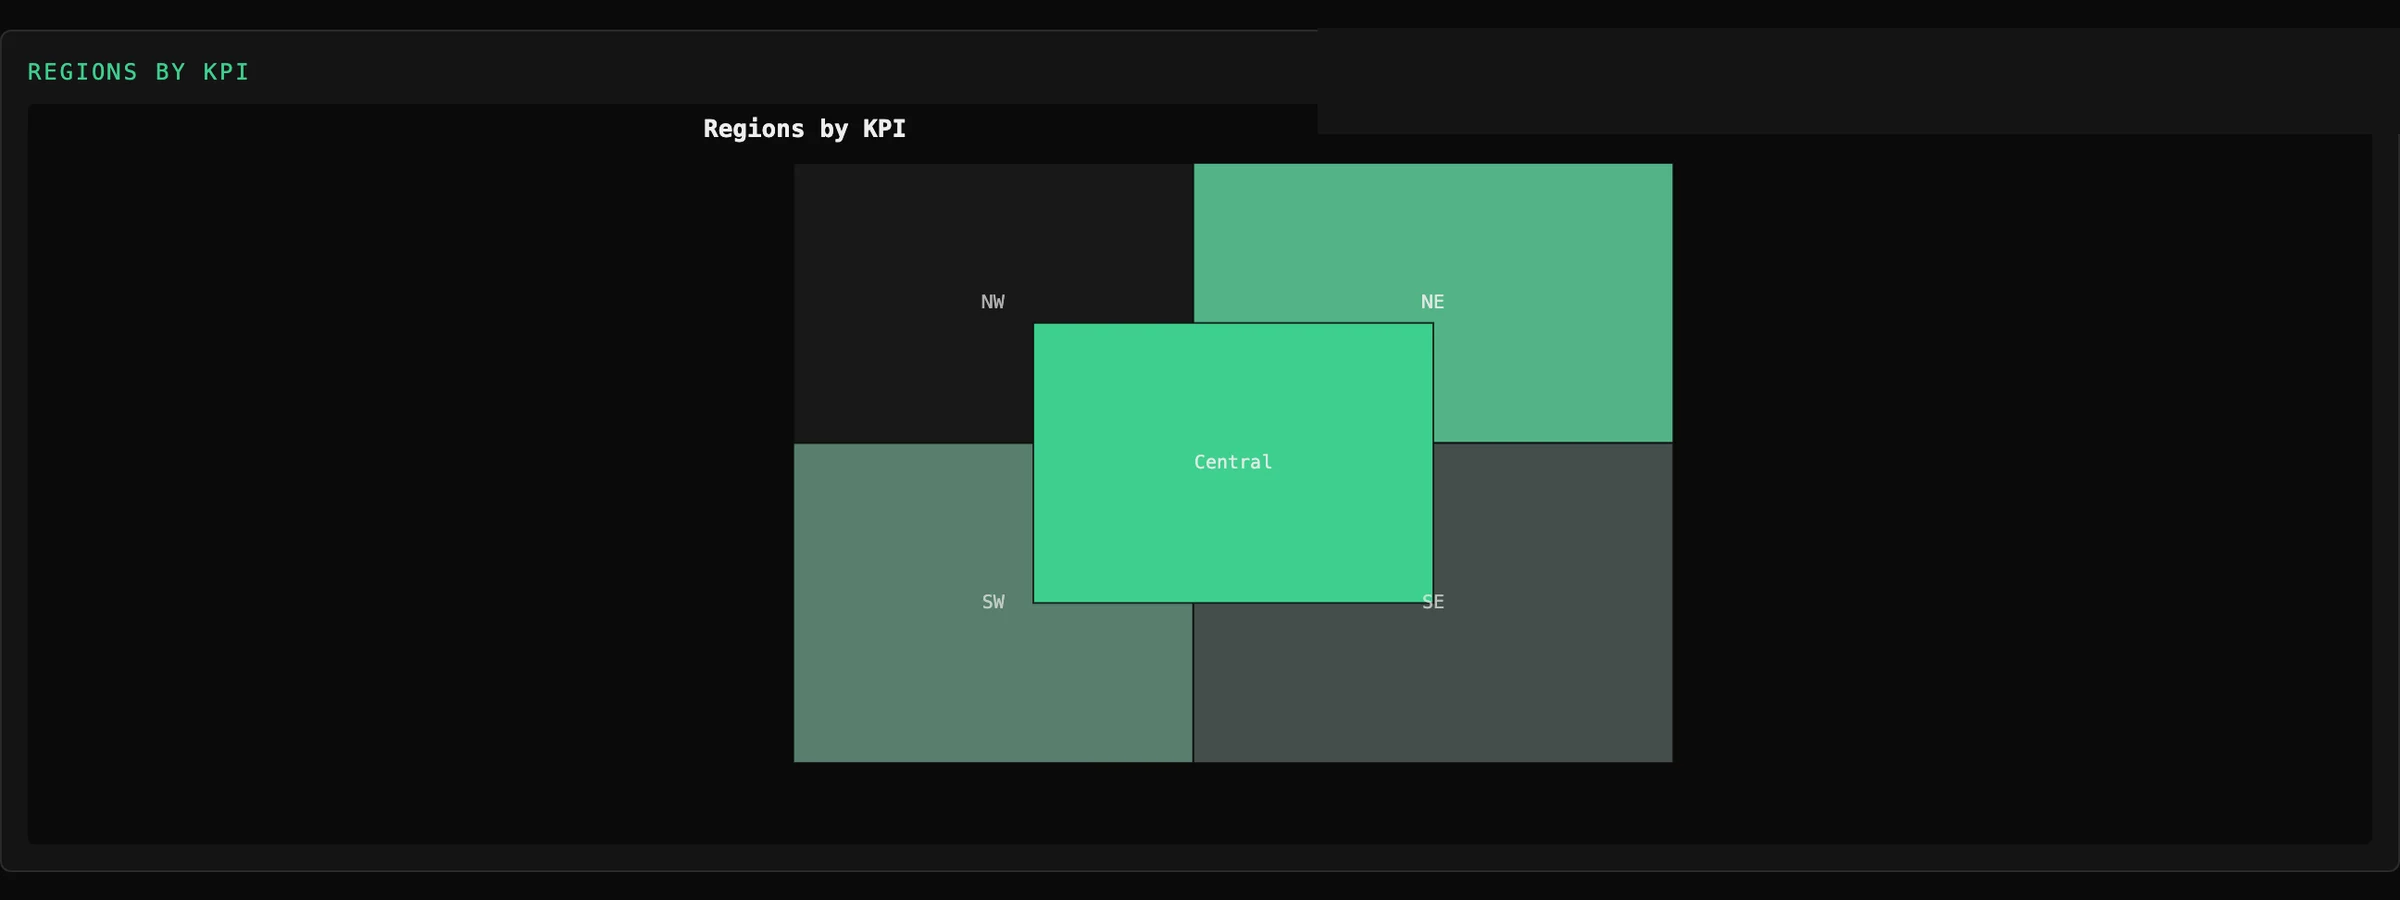
Choropleth
Geospatial
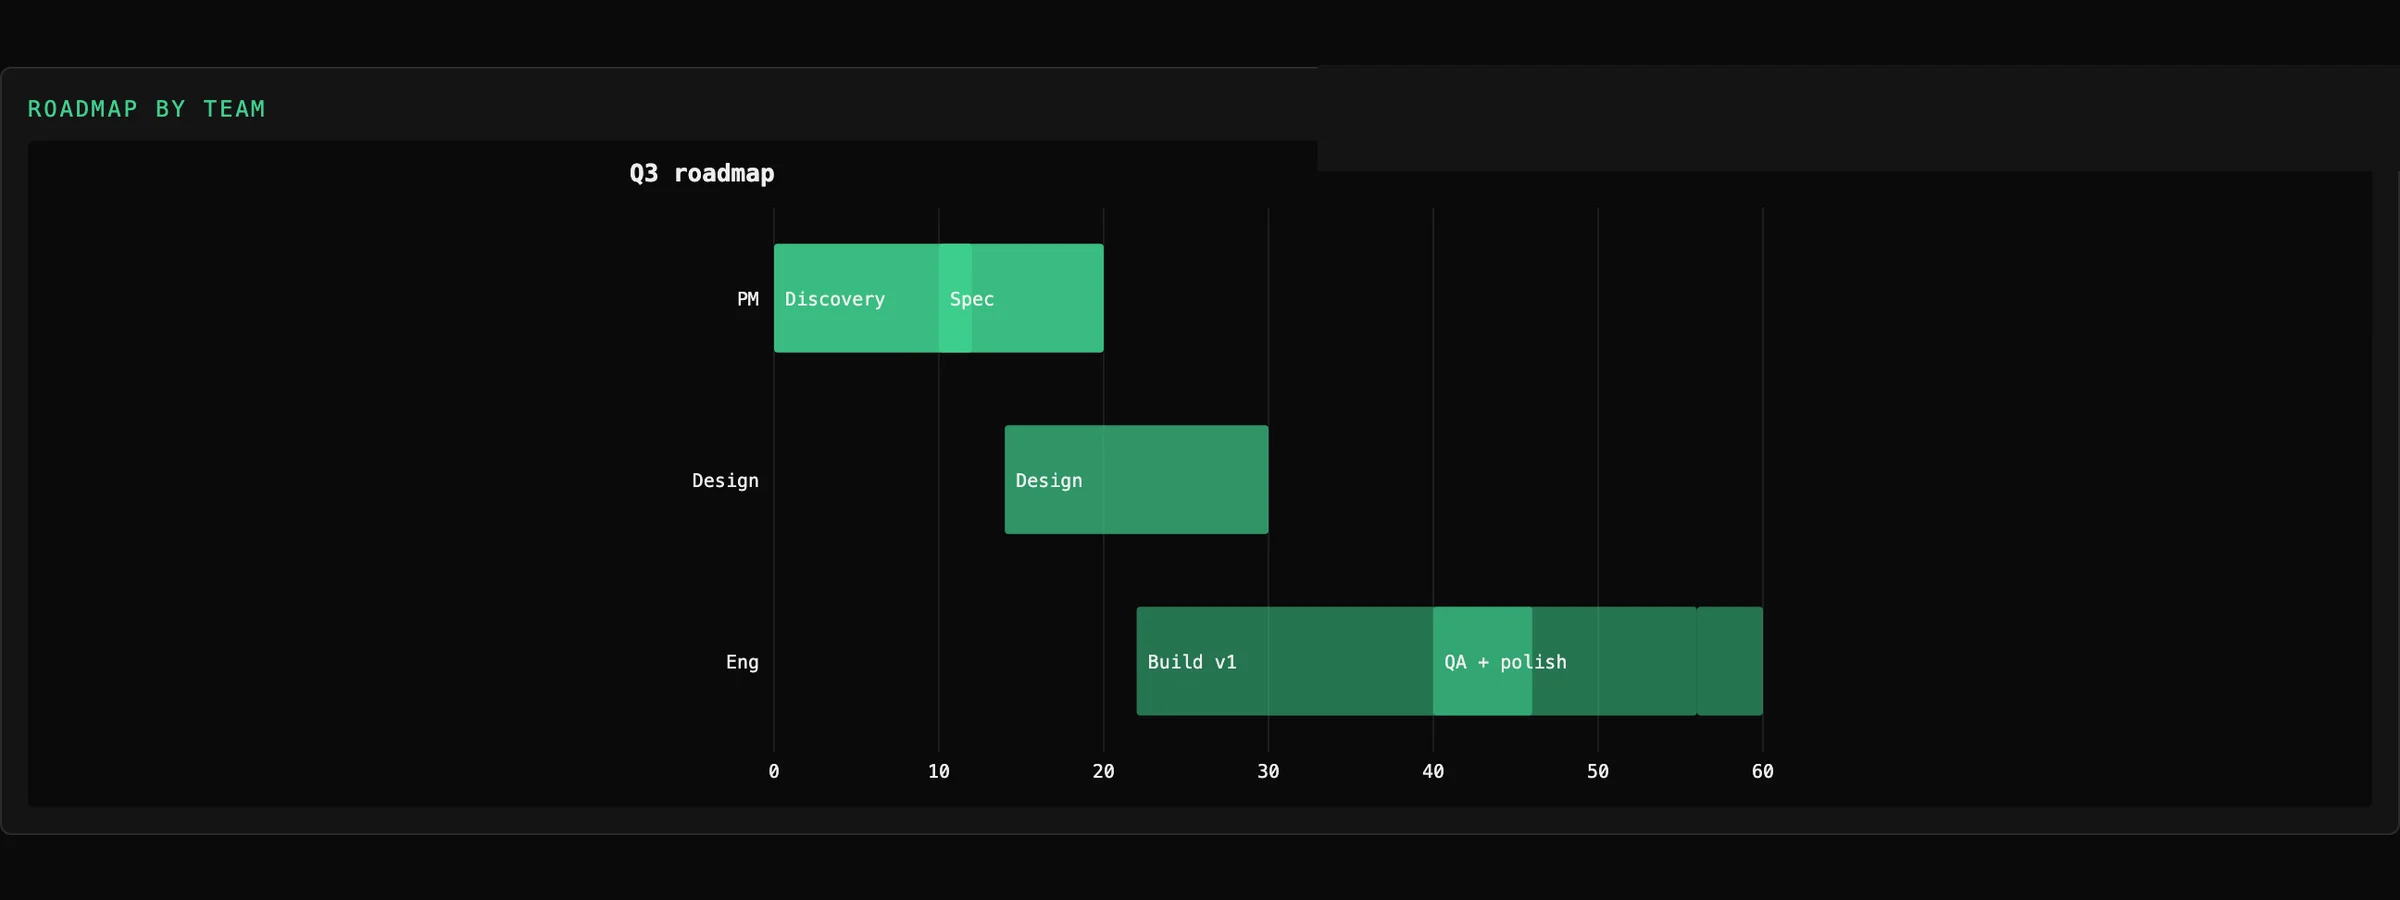
Gantt timeline
Composition
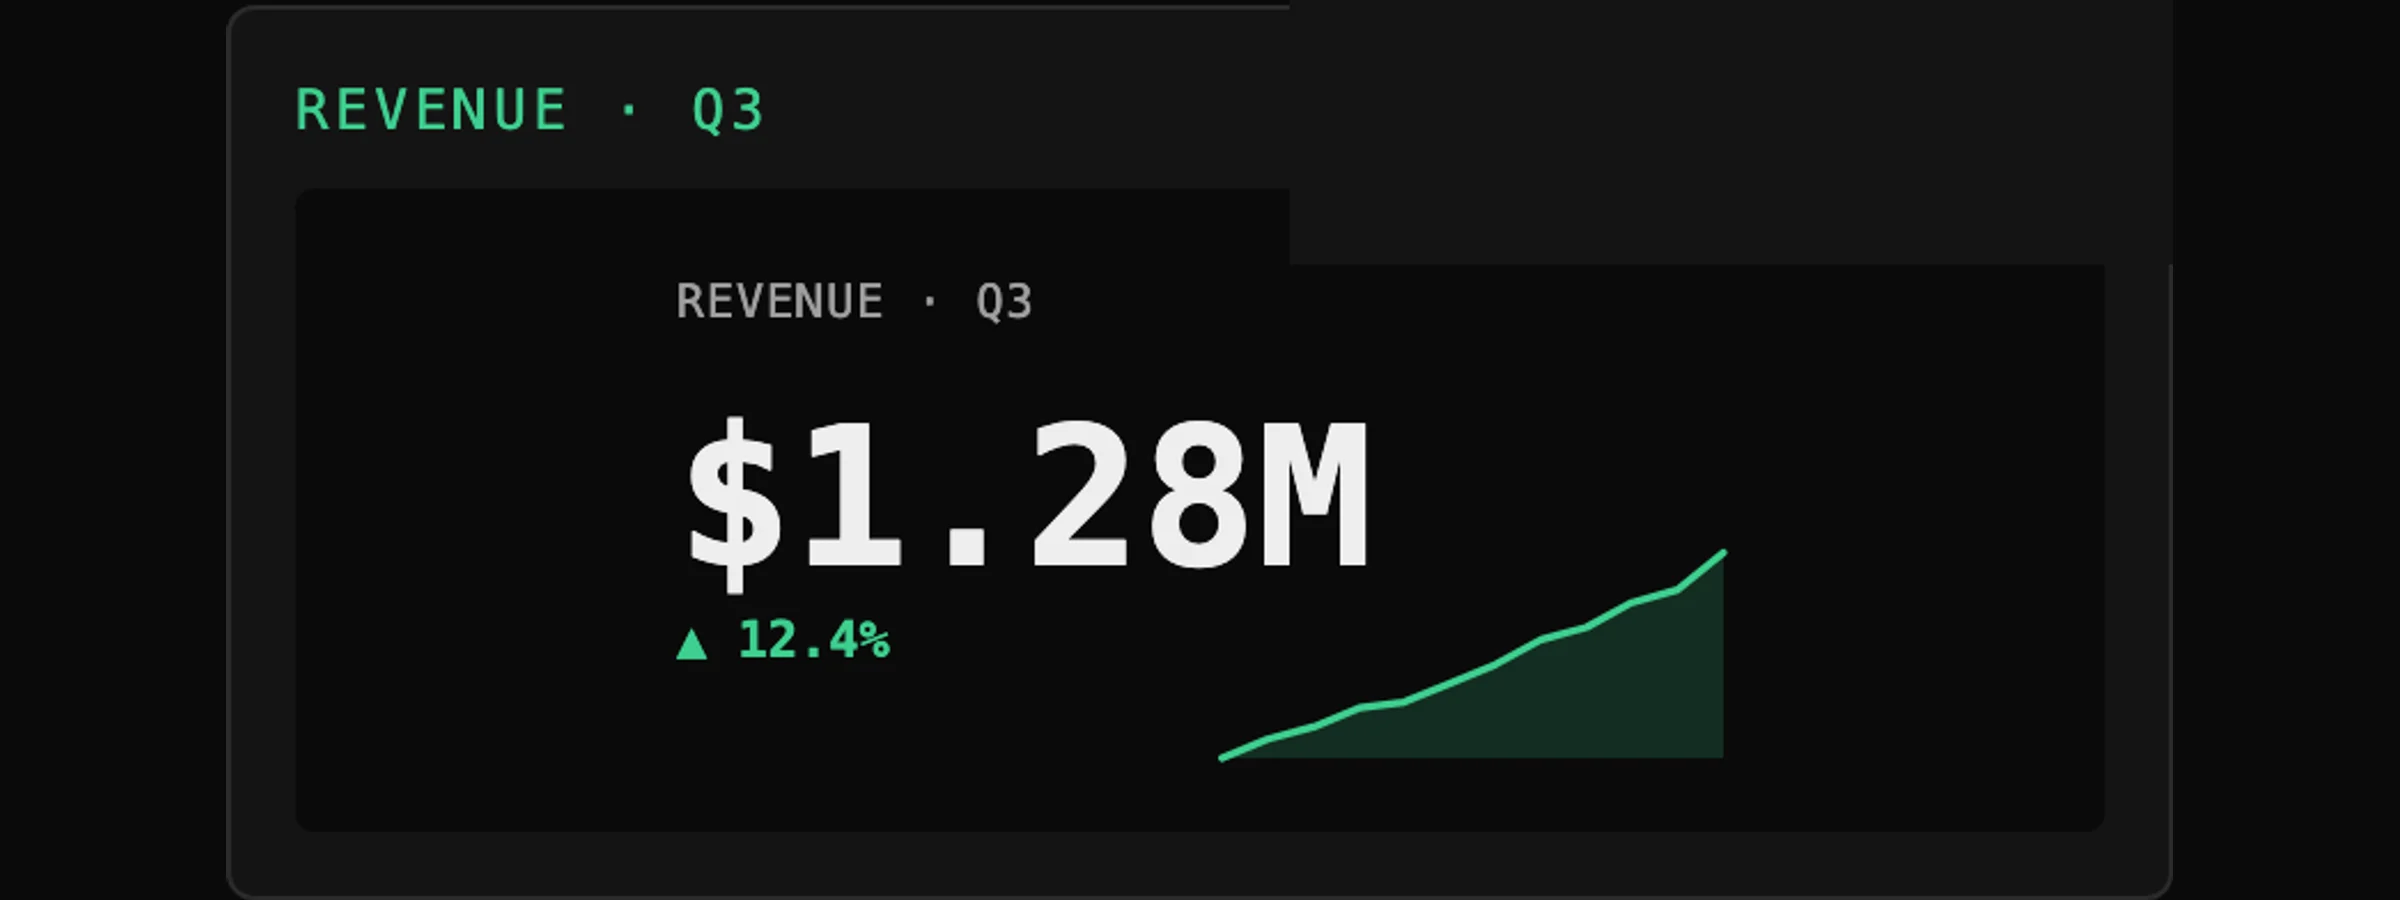
KPI card
Indicator
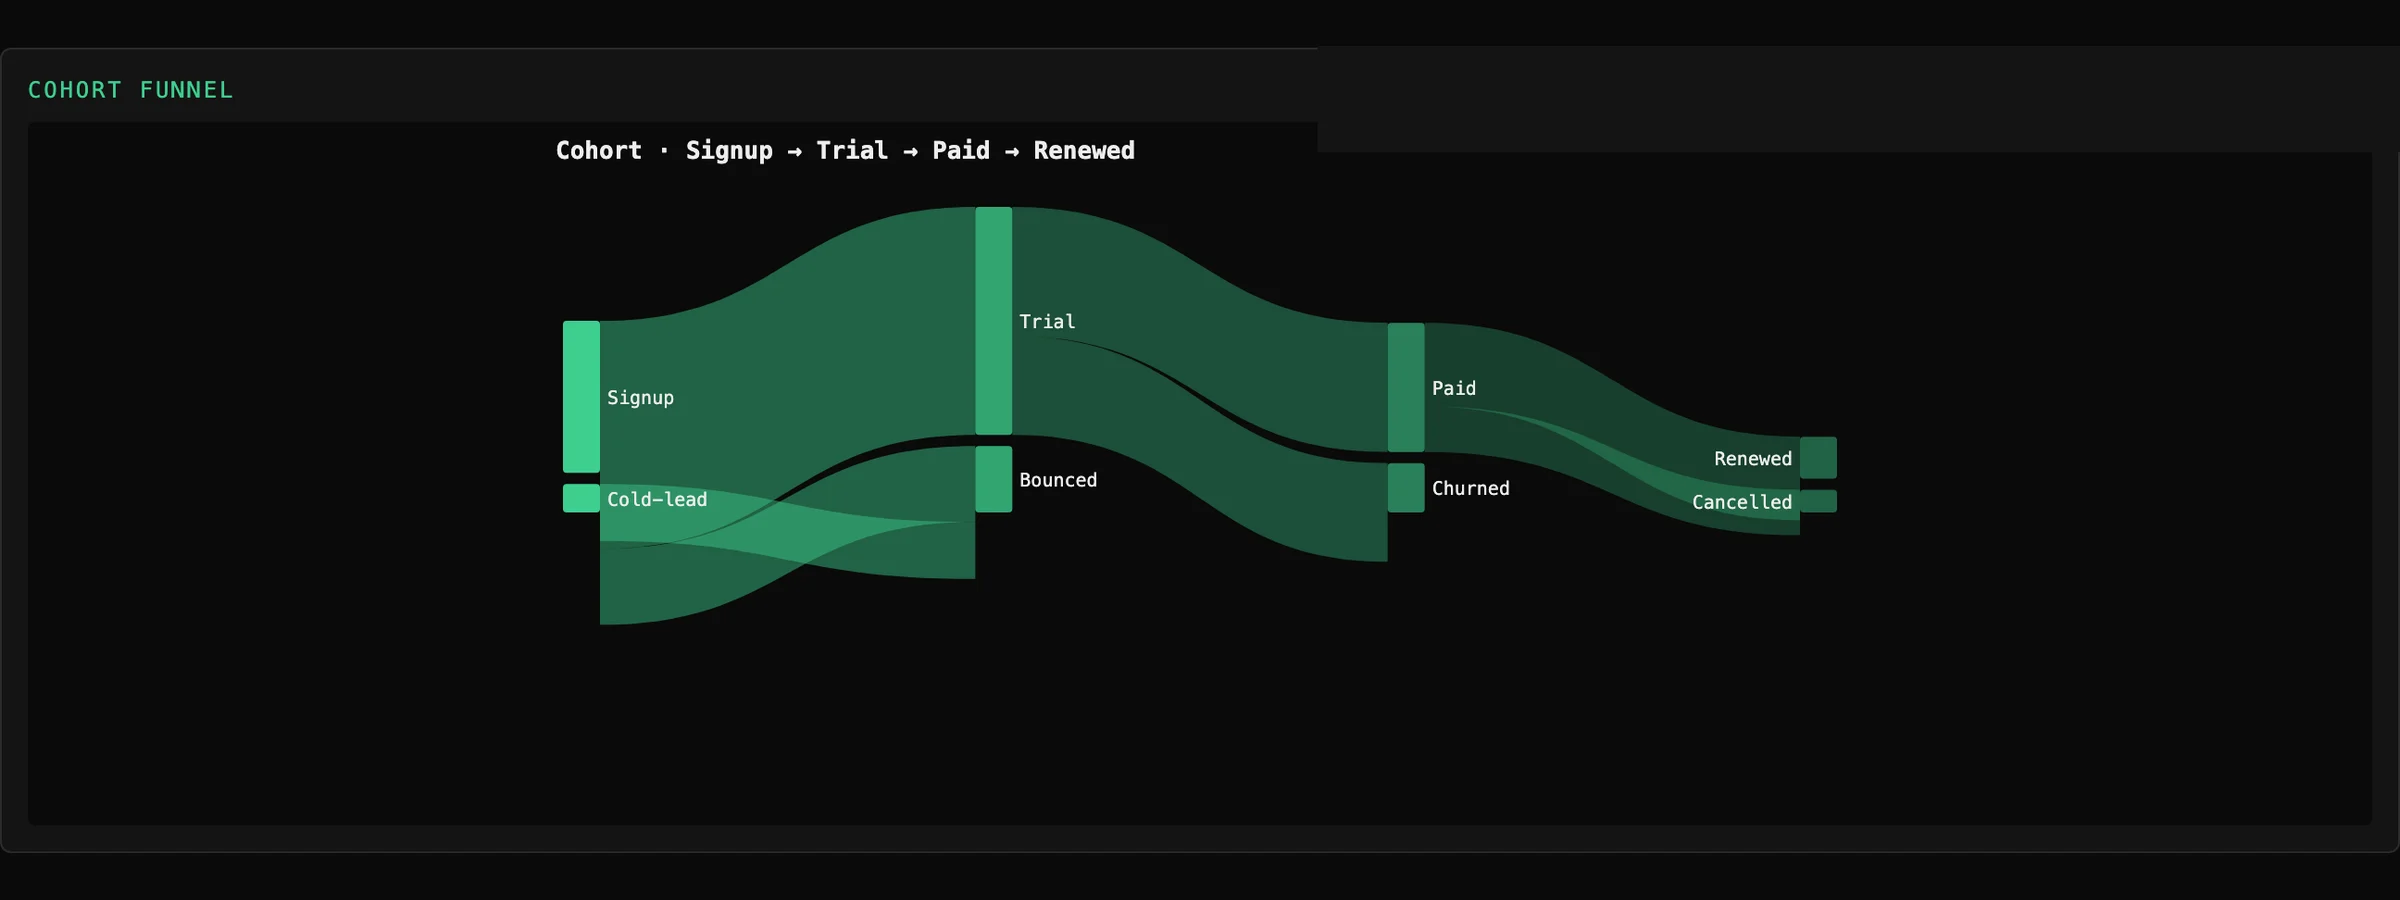
Alluvial
Flow and relationship
Sixteen idioms, one theme, one data shape. Every one of these is a screenshot of the running build rather than an illustration of it.
05
Where it stops
06
What it won't do yet.
01
Presentation, not analysis
No statistical modelling and no forecasting. Compute the numbers, and hand us the numbers.
02
Very large scatter plots
Beyond about 100,000 points, bin them — use hexbin or density. We will render 100,000 points; your users cannot see them.
06
Where next
06