Tessera Viz
PX-02
Financial crime and AML
See the money move.
An analyst looking at a suspicious transaction needs three things at once: who is connected to whom, when it happened, and where. Today that is usually three tools and a spreadsheet, and the work of holding them together is the analyst's.
01
03
Close cases faster, with every clue on one screen.
01
What the analyst gets
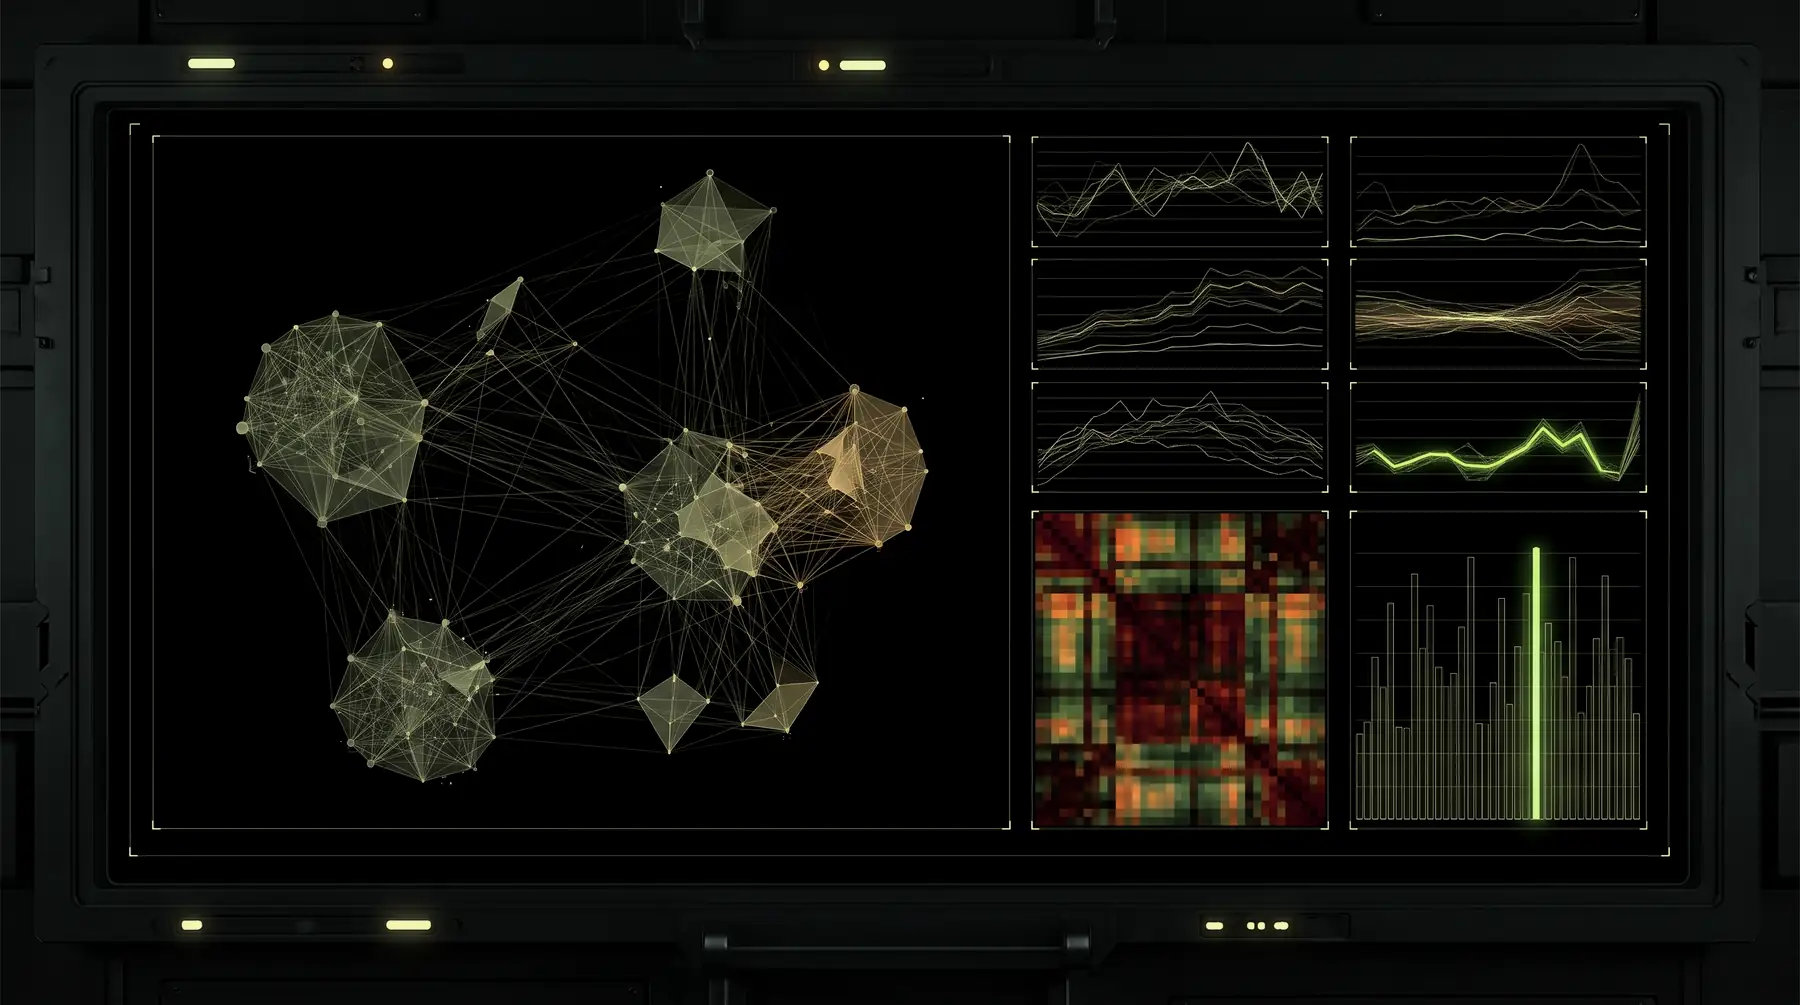
The account network as a graph, the transaction sequence as a timeline, counterparty geography as a map and the underlying rows as a grid — all one selection. Click an account and the timeline shows its transfers, the map shows its counterparties, the grid scrolls to its rows.
02
Community detection
Surfaces structuring rings: the cluster of accounts that move money between themselves more than they move it anywhere else. It is the shape the technique leaves behind, and it is visible before anyone writes a rule for it.
03
Betweenness
Finds the intermediaries. The account that sits on the path between two clusters is the one worth a subpoena, and centrality ranks it without anyone guessing.
04
Min-cut
Finds the chokepoint in a layering chain — the smallest set of transfers whose removal disconnects the source from the destination.
05
Tweak layout
Re-runs the layout while keeping existing positions stable, so a live feed does not scramble the analyst's mental map every time it arrives. An investigation is hours long; the picture has to survive it.
06
The compliance angle
Deploys air-gapped. No telemetry and no phone-home. An SBOM is provided, and the licence is verified locally with a signature rather than a call to us.
02
And with an agent
03
Ask in words. Get the network back.
01
What it changes here
“Show me everything that moved through this account in March, coloured by community” becomes a chart in the chat rather than a ticket to the analytics team. The analyst asks the next question instead of waiting for the first answer.
02
A document, not a picture
The model returns one JSON document — the graph, the layout, the algorithm, the theme — and the library draws it in the page. Nothing renders server-side, so there is no image to regenerate when the next question changes the filter.
03
Checked before it draws
The document is validated first. A field the model invented comes back as a list of issues rather than as a blank panel or a thrown error, which is the difference between an agent that can be trusted in front of an analyst and one that cannot.
04
It can arrive as it is written
The stream reader takes the document while the model is still producing it, so a large graph starts appearing at the first complete object instead of after the last token.
05
MCP carries it; this draws it
Expose that document as the return value of an MCP tool and an agent draws straight into the conversation. The library does not implement MCP, any more than an image decoder implements HTTP — it is the renderer at the end of whichever transport you already run.
06
Why this is possible at all
Because the drawing runs in the browser and takes its instructions as data. A library that renders server-side hands an agent a picture; this one hands it a surface that the next question can change.